Download
1 / 22
220 likes | 327 Views
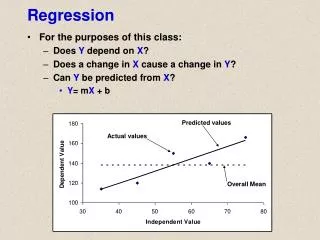
Regression. For the purposes of this class: Does Y depend on X ? Does a change in X cause a change in Y ? Can Y be predicted from X ? Y = m X + b. Predicted values. Actual values. Overall Mean. When analyzing a regression-type data set, the first step is to plot the data:.

E N D
Regression • For the purposes of this class: • Does Y depend on X? • Does a change in X cause a change in Y? • Can Y be predicted from X? • Y= mX + b Predicted values Actual values Overall Mean
When analyzing a regression-type data set, the first step is to plot the data: The next step is to determine the line that ‘best fits’ these points. It appears this line would be sloped upward and linear (straight).
Rise/Run The line of best fit is the sample regression of Y on X, and its position is fixed by two results: Y = 1.24(X) + 69.8 slope Y-intercept (55, 138) 1) The regression line passes through the point (Xavg, Yavg). 2) Its slope is at the rate of “m” units of Y per unit of X, where m = regression coefficient (slope; y=mx+b)
Testing the Regression Line for Significance • An F-test is used based on Model, Error, and Total SOS. • Very similar to ANOVA • Basically, we are testing if the regression line has a significantly different slope than a line formed by using just Y_avg. • If there is no difference, then that means that Y does not change as X changes (stays around the average value) • To begin, we must first find the regression line that has the smallest Error SOS.
180 160 140 Dependent Value 120 100 30 40 50 60 70 80 Independent Value Error SOS The regression line should pass through the overall average with a slope that has the smallestError SOS (Error SOS = the distance between each point and predicted line: gives an index of the variability of the data points around the predicted line). 138 overall average is the pivot point 55
For each X, we can predict Y: Y = 1.24(X) + 69.8 Error SOS is calculated as the sum of (YActual – YPredicted)2 This gives us an index of how scattered the actual observations are around the predicted line. The more scattered the points, the larger the Error SOS will be. This is like analysis of variance, except we are using the predicted line instead of the mean value.
Total SOS • Calculated as the sum of (Y – Yavg)2 • Gives us an index of how scattered our data set is around the overall Y average. Regression line not shown Overall Y average
Total SOS gives us an index of how scattered the data points are around the overall average. This is calculated the same way for a single treatment in ANOVA. What happens to Total SOS when all of the points are close to the overall average? What happens when the points form a non-horizontal linear trend?
Model SOS • Calculated as the Sum of (YPredicted – Yavg)2 • Gives us an index of how far away the predicted values are from the overall average value Distance between predicted Y and overall mean
Model SOS • Gives us an index of how far away the predicted values are from the overall average value • What happens to Model SOS when all of the predicted values are close to the average value?
Using SOS to Assess Regression Line • Model SOS gives us an index on how ‘different’ the predicted values are from the average values. • Bigger Model SOS = more different • Tells us how different a sloped line is from a line made up only of Y_avg. • Remember, the regression line will pass through the overall average point. • Error SOS gives us an index of how different the predicted values are from the actual values • More variability = larger Error SOS = large distance between predicted and actual values
Magic of the F-test • The ratio of Model SOS to Error SOS (Model SOS divided by Error SOS) gives us an overall index (the F statistic) used to indicate the relative ‘difference’ between the regression line and a line with slope of zero (all values = Y_avg. • A large Model SOS and small Error SOS = a large F statistic. Why does this indicate a significant difference? • A small Model SOS and a large Error SOS = a small F statistic. Why does this indicate no significant difference?? • Based on sample size and alpha level (P-value), each F statistic has an associated P-value. • P < 0.05 (Large F statistic) there is a significant difference between the regression line a the Y_avg line. • P ≥ 0.05 (Small F statistic) there is NO significant difference between the regression line a the Y_avg line.
180 160 Dependent Value 140 120 100 30 40 50 60 70 80 Independent Value Mean Model SOS Mean Error SOS = F Basically, this is an index that tells us how different the regression line is from Y_avg, and the scatter of the data around the predicted values.
Rise/Run Y = 1.24(X) + 69.8 slope Y-intercept Use regression line to predict a specific number or a specific change.
Correlation (r):Another measure of the mutual linear relationship between two variables. • ‘r’ is a pure number without units or dimensions • ‘r’ is always between –1 and 1 • Positive values indicate that y increases when x does and negative values indicate that y decreases when x increases. • What does r = 0 mean? • ‘r’ is a measure of intensity of association observed between x and y. • ‘r’ does not predict – only describes associations between variables
r > 0 r < 0 r is also called Pearson’s correlation coefficient. r = 0
R-square • If we square r, we get rid of the negative value if it is negative and we get an index of how close the data points are to the regression line. • Allows us to decide how much confidence we have in making a prediction based on our model. • Is calculated as Model SOS / Total SOS
= Model SOS = Total SOS r2 = Model SOS / Total SOS
= Model SOS = Total SOS R2 = 0.8393 r2 = Model SOS / Total SOS numerator/denominator Small numerator Big denominator
Finally…….. • If we have a significant relationship (based on the p-value), we can use the r-square value to judge how sure we are in making a prediction.


