Download
1 / 33
330 likes | 462 Views
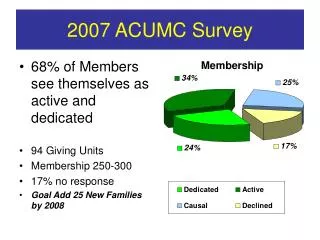
Massachusetts Employer Survey 2007. Division of Health Care Finance and Policy Executive Office of Health and Human Services. Contents. Employer health insurance offer rates Employee take-up rates Employer contribution rates and employee cost sharing

E N D
Massachusetts Employer Survey 2007 Division of Health Care Finance and Policy Executive Office of Health and Human Services
Contents • Employer health insurance offer rates • Employee take-up rates • Employer contribution rates and employee cost sharing • Employer awareness of Commonwealth Health Insurance Connector
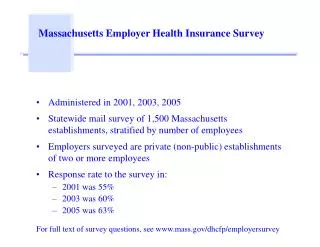
Survey Methodology • Fourth round of a biennial survey administered in 2001, 2003, 2005, and 2007 • Survey conducted by the Center for Survey Research, University of Massachusetts Boston, on behalf of the Division of Health Care Finance and Policy • Statewide mail survey of 1,550 private (non-public) establishments with two or more employees in Massachusetts • Same survey questionnaire used in all years, with modifications. In 2007 more detailed information was requested to assess impact of health reform. • Sample is stratified by the number of employees, with an over-sampling of the smallest employers • Weights are calculated to present findings reflecting Massachusetts employer population • 2007 response rate was 55%
Employers Offering Health InsurancePercent of Employers Nearly three-quarters of Massachusetts employers offer health insurance to their employees. The offer rate has remained stable with no statistically significant change, even as the national offer rate declined to 60% in 2007 from 68% in 2001. National Data Source: Kaiser/HRET Survey of Employer Sponsored Benefits
Employer Offer Rate by Employer SizePercent of Employers (2007) Very small employers are much less likely to offer health insurance. Virtually all employers with more than 50 employees offer coverage.
Employers Offering Health Insurance to SpousesPercent of Employers The employer offer rate to employees’ opposite sex spouses has remained stable since 2001. Same-sex marriage was legalized in Massachusetts in 2004. However, offer rates for same-sex spouses remains below that of opposite-sex spouses because self-insured employers do not have to follow state rules, but rather are governed by federal rules.
Employers Offering Health Insurance to Unmarried PartnersPercent of Employers About one-third of Massachusetts employers offer health insurance to unmarried partners, with employers nearly equally likely to offer to opposite-sex partners as to same-sex partners.
Employer Offer Rates to Part Time Employees • Three-quarters of Massachusetts employers offering health insurance only offer to full time employees • In 2007, for employers offering health insurance to part time employees, nearly half offer to employees working more than half time (49%) and nearly one-quarter offer to employees working half time (24%).
Offer Rate by Relation to the Median Percentage of Part Time EmployeesPercent of Employers (2007) Employers with a greater proportion of part time employees are less likely to offer health insurance. This differential is most apparent among the smallest employers, and almost disappears among larger employers.
Employee Age by Offering and Non-Offering Employers Percent Distribution of Employees (2007) Firms that do not offer coverage have a greater proportion of older workers and firms that offer coverage have a greater proportion of workers ages 27-39.
Employer Offer Rate by IndustryPercent of Employers (2007) Offer rates vary by industry. This variation somewhat reflects differences in employer size across industries, and is likely also a function of the level of part time employees. Note: A very small number of agriculture/forestry/fishing employers participated in the survey, so that offer rate should be interpreted with caution.
Employer Offer Rate by RegionPercent of Employers (2007) Some of the variation in offer rates by region reflects employer size (e.g., the northeast region has more small employers). However, size of employers in the Southeast region, are no different from the state as a whole, yet there is a higher than average offer rate there.
Employers Offering Health Insurance to Their Retirees Ages 65 and OlderPercent of Employers Only about ten percent of employers offer health insurance to their retirees, and significantly fewer employers offered health insurance to retired employees in 2007 than in 2001.
Employers Offering Pre-Tax IRS Section 125 Plan by Firm SizePercent of Employers An IRS Section 125 plan (or “Cafeteria Plan”) allows employees to contribute their portion of the health insurance premium on a pre-tax basis. Most large employers offered this benefit to their employees in 2007 compared with half of small employers.
Employer Reasons for Not Offering Health Insurance(2001, 2003, 2005, 2007) Percentages are based on combination of "very important" and "somewhat important."
Median Take-Up Rate by Employer SizeFor Employers that offer Health Insurance (2007) More than three-quarters of employees eligible for their employers’ coverage enroll in the plan. This rate is similar for employers of different sizes.
Median Take-Up Rate by Relation to the Median Percentage of Part Time Employees For Employers that offer Health Insurance (2007) Firms with fewer part time employees experience a higher take-up rate of their offered insurance. The variance is more pronounced among smaller firms. These figures reflect the median percentage of eligible employees who enroll.
Median Take-Up Rate by IndustryFor Employers that offer Health Insurance (2007) Industries with relatively lower take-up rates are not necessarily the same as those with low offer rates. This chart is sorted from the industry with the highest offer rate to the lowest. Note: A very small number of agriculture/forestry/fishing employers participated in the survey, so that offer rate should be interpreted with caution.
Employees Who are Covered by their Employer’s Health Insurance The majority of eligible employees enroll in their employer sponsored health insurance. However, not all employees are eligible; three quarters of employers offer health insurance only to full time employees, and 59% impose a waiting period before employees can enroll.
Median Monthly Employer Contribution to Individual and Family Plan Premiums Employers contribute three-quarters of the cost of an individual or a family plan premium. This is true regardless of firm size. The contribution level for family plans has remained steady since 2001. The contribution level for individual plans has fallen slightly since 2001.
Median Total Monthly Premium for Individual Health Insurance Plans Small firms pay higher premiums than large firms, although the gap seems to be narrowing. Small firms’ monthly premium costs for an individual plan have increased by 14.5% since 2005 and by 64.6% since 2001.
Median Monthly Employee Contribution to an Individual Plan Premium Employees’ monthly share of an individual plan premium increased 153 percent from 2001 to 2007.
Median Monthly Employee Contribution to Individual Plan Premium by Employer Size Between 2001 and 2007, employees working for small firms experienced a larger proportional increase in their share of an individual plan premium than employees working for large firms.
Median Monthly Total Premium for Family Health Insurance Plans Small firms’ monthly premium costs for a family plan increased 12.4% since 2005 and 64.3% since 2001. Large firms’ monthly premium costs for a family plan increased 14.7% since 2005 and 73.6% since 2001. In 2007, large firms paid more for family coverage than did small firms.
Median Monthly Employee Contribution to Family Plan Premium The median employee contribution to a family plan premium has increased 24.7% since 2005 and 73.3% since 2001.
Median Monthly Employee Contribution to Family Plan Premium by Employer Size Employees working for small firms are paying $20 more a month (at the median) in 2007 than are employees working for large firms.
Median Co-Payments/Deductible by Service Type and Year Co-payments and inpatient deductibles have remained stable since 2005 with increases in outpatient mental health and Tier 3 Drugs.
Employers Who Have Heard of Commonwealth Choice or the Commonwealth Connector (2007) Regardless of whether or not they offer health insurance to their employees, employers were unaware of the Commonwealth Health Insurance Connector in 2007.
Report Contributors: Cindy Wacks, Tony Roman from the UMass Center for Survey Research, Bob Seifert from the UMass Medical School Center for Health Law and Economics, and Nga Vuong Division of Health Care Finance and Policy Two Boylston Street Boston, MA 02116 Phone: (627) 988-3100 Fax: (617) 727-7662 Website: www.mass.gov/dhcfp Publication Number: 09-219-08 HCF