Download
1 / 60
610 likes | 642 Views
Chapter 14. Cost Allocation, Customer- Profitability Analysis, and Sales-Variance Analysis. Learning Objective 1. Identify four purposes for allocating costs to cost objects. Purposes of Cost Allocation. 1. To provide information for economic decisions.

E N D
Chapter 14 Cost Allocation, Customer-Profitability Analysis, andSales-Variance Analysis
Learning Objective 1 Identify four purposes for allocating costs to cost objects.
Purposes of Cost Allocation 1. To provide information for economic decisions 2. To motivate managers and other employees 3. To justify costs or compute reimbursement 4. To measure income and assets for reporting to external parties
Learning Objective 2 Guide cost-allocation decisions using appropriate criteria.
Criteria to GuideCost-Allocation Decisions Cause-and-effect: Using this criterion, managers identify the variable or variables that cause resources to be consumed. Benefits-received: Using this criterion, managers identify the beneficiaries of the outputs of the cost object.
Criteria to GuideCost-Allocation Decisions Fairness or equity: This criterion is often cited on government contracts when cost allocations are the basis for establishing a price satisfactory to the government and its suppliers. Ability to bear: This criterion advocates allocating costs in proportion to the cost object’s ability to bear them.
Role of Dominant Criteria The cause-and-effect and the benefits- received criteria guide most decisions related to cost allocations. Fairness and ability to bear are less frequently used. Why?
Role of Dominant Criteria Fairness is an especially difficult criterion to obtain agreement on. The ability to bear criterion raises issues related to cross-subsidization across users of resources in an organization.
Learning Objective 3 Discuss decisions faced when collecting costs in indirect-cost pools.
Cost Allocation andCosting Systems Example Smith Corporation manufactures clothes washers and dryers in two divisions: Clothes Washer Division in Canton (CWD) Clothes Dryer Division in Dayton (CDD)
Cost Allocation andCosting Systems Example Corporate costs: Treasury $ 600,000 Human resources $1,200,000 Administration $4,800,000 Treasury cost is interest to finance equipment acquisition of $4,000,000 in Canton and $2,000,000 in Dayton.
Cost Allocation andCosting Systems Example Division costs: CantonDayton Direct costs $2,200,000 $4,000,000 Indirect costs 1,980,000 2,500,000 Total $4,180,000 $6,500,000
Cost Allocation andCosting Systems Example If Smith Corporation allocates corporate costs to divisions, how many cost pools should it use to allocate corporate costs? One single cost pool? Numerous individual corporate cost pools? A key factor is the concept of homogeneity. Which allocation basis should Smith Corporation use to allocate treasury costs?
Cost Allocation andCosting Systems Example Treasury costs: $600,000 Canton Division: $600,000 × ($4,000,000 ÷ $6,000,000) = $400,000 Dayton Division: $600,000 × ($2,000,000 ÷ $6,000,000) = $200,000
Cost Allocation andCosting Systems Example Smith Corporation allocates human resources on the basis of total direct labor costs incurred in each division. Suppose direct labor costs in Canton are $1,200,000 and $1,800,000 in Dayton. How does Smith Corporation allocate its $1,200,000 of human resources costs?
Cost Allocation andCosting Systems Example Canton Division: $1,200,000 × ($1,200,000 ÷ $3,000,000) = $480,000 Dayton Division: $1,200,000 × ($1,800,000 ÷ $3,000,000) = $720,000 Smith does not allocate corporate administration costs to the divisions.
Cost Allocation andCosting Systems Example CantonDayton Treasury costs: $600,000 (2/3 and 1/3) $400,000 $200,000 Human resources costs: $1,200,000 40% and 60% 480,000 720,000 Total allocated to divisions $880,000 $920,000
Cost Allocation andCosting Systems Example Treasury costs are reallocated by the divisions to Assembly. Human resources costs are reallocated by the divisions to the Dept. of Human Resources.
Cost Allocation andCosting Systems Example Canton Division Assembly direct costs $1,300,000 Corporate costs 400,000 Total costs $1,700,000 Finishing direct costs: $900,000
Cost Allocation andCosting Systems Example Canton Division Human Resources direct costs: $1,680,000 Corporate costs: 480,000 Total costs $2,160,000 Maintenance direct costs: $300,000
Cost Allocation andCosting Systems Example Assembly Dept. $1,700,000 Finishing Dept. $900,000 Canton Division $5,060,000 Maintenance Dept. $300,000 Human Resources Dept. $2,160,000
Learning Objective 4 Discuss why a company’s revenues can differ across customers purchasing the same product.
Customer RevenueAnalysis Example During the first six months of 2003, English Languages Institute expanded its market and sold 200 composition programs to two new customers in Mexico. Customer A is in Tijuana and customer B is in Guadalajara.
Customer RevenueAnalysis Example Customer AB Programs sold 140 60 List selling price $185 $185 Invoice price $175 $180 Total revenues $24,500 $10,800 What explanation(s) can be given for these revenue differences?
Customer RevenueAnalysis Example 1. The volume of programs purchased 2. The magnitude of price discounting
Customer Cost Analysis Example Assume that English Languages Institute has an activity-based costing system that focuses on customers rather than products. Activity AreaCost Driver and Rate Order taking $ 80 per purchase Order set up $100 per batch
Customer Cost Analysis Example Customer ACustomer B Number of: Purchase orders 7 2 Batches 7 2 What is the cost of servicing each customer?
Customer Cost Analysis Example Customer A: Ordering: 7 × $80/order = $ 560 Set-up: 7 × $100/batch = 700 Total $1,260 English can use this information to persuade this customer to reduce usage of the ordering and setup cost drivers.
Customer Cost Analysis Example Customer B: Ordering: 2 × $80/order = $160 Setup: 2 × $100/batch = 200 Total $360
Learning Objective 5 Apply the concept of cost hierarchy to customer costing.
Cost Hierarchy General Motors uses a seven-level cost hierarchy to analyze profitability. The aim of this cost hierarchy is to assign costs to the lowest level of the hierarchy at which they can be identified.
Cost Hierarchy 1. Enterprise-related activities 2. Market-related activities 3. Channel-related activities 4. Customer-related activities 5. Order-related activities 6. Parts-related activities 7. Direct materials
Learning Objective 6 Discuss why customer-profitability differs across customers.
Customer-Profitability Profiles Which customer is more profitable, A or B? AB Revenues $24,500 $10,800 Cost of good sold ($95 per unit) 13,300 5,700 Contribution margin $11,200 $ 5,100 Other expenses 1,260 360 Operating income $ 9,940 $ 4,740
Customer-Profitability Profiles Customer A seems to be more profitable. However, customer B has a higher gross profit percentage. Customer A has a gross profit of 40.6% ($9,940 ÷ $24,500). Customer B has a gross profit of 43.9% ($4,740 ÷ $10,800).
Learning Objective 7 Provide additional information about the sales-volume variance by calculating the sales-mix variance and the sales-quantity variance.
Sales-VolumeVariance Components The following information relates to English Languages Institute budget for the year 2003. ProductGrammarTrans.Comp. Selling price per unit $259 $87 $185 Variable cost 189 50 95 Contribution margin per unit $ 70 $37 $ 90
Sales-VolumeVariance Components Product Grammar Translation Composition Cont. margin $70 $37 $90 × Units 3,185 980 735 = Total $222,950 $36,260 $66,150 Sales mix 65% 20% 15% Total budgeted contribution margin = $325,360
Sales-VolumeVariance Components The following are the actual results for English Languages for the year 2003. Product Grammar Translation Composition Selling $/unit $255 $85 $185 Variable cost 180 45 95 Cont. margin per unit $ 75 $40 $ 90
Sales-VolumeVariance Components Product Grammar Translation Composition Cont. margin $75 $40 $90 × Units 2,880 990 630 = Total $216,000 $39,600 $56,700 Sales mix 64% 22% 14% Total actual contribution margin = $312,300
Static-Budget Variance Static- Static- Actual budget budget Productresultsamountvariance Grammar $216,000 $222,950 $ 6,950 U Translation 39,600 36,260 3,340 F Composition 56,700 66,150 9,450 U Total $312,300 $325,360 $13,060 U
Flexible-Budget Variance Actual contribution Unit Actual Productmargin/unitvolumeresults Grammar $75 2,880 $216,000 Translation $40 990 $ 39,600 Composition $90 630 $ 56,700
Flexible-Budget Variance Budgeted Actual contribution unit Flexible Productmargin/unitvolumebudget Grammar $70 2,880 $201,600 Translation $37 990 $ 36,630 Composition $90 630 $ 56,700
Flexible-Budget Variance Flexible- Flexible- Actual budget budget Productresultsamountvariance Grammar $216,000 $201,600 $14,400 F Translation $39,600 $ 36,630 $ 2,970 F Composition $56,700 $ 56,700 0 Total flexible-budget variance $17,370 F
Sales-Volume Variance Budgeted contribution ProductActualBudgetmargin Grammar (2,880 – 3,185) × $70 = $21,350 U Translation (990 – 980) × $37 = 370 F Composition (630 – 735) × $90 = 9,450 U Total sales-volume variance $30,430 U
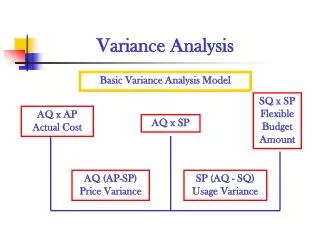
Sales-Mix Variance Sales-mix variance = Actual units of all products sold × Actual sales-mix percentage – Budgeted sales-mix percentage × Budgeted contribution margin per unit
Sales-Mix Variance Grammar: 4,500(0.64 – 0.65) × $70 = $3,150 U Translation: 4,500(0.22 – 0.20) × $37 = $3,330 F Composition: 4,500(0.14 – 0.15) × $90 = $4,050 U Total sales-mix variance = $3,870 U
Sales-Quantity Variance Sales-quantity variance = Actual units of all products sold – Budgeted units of all products sold × Budgeted sales-mix percentage × Budgeted contribution margin per unit
Sales-Quantity Variance Grammar: (4,500 – 4,900) × 0.65 × $70 = $18,200 U Translation: (4,500 – 4,900) × 0.20 × $37 = $ 2,960 U Composition: (4,500 – 4,900) × 0.15 × $90 = $ 5,400 U Total sales-quantity variance = $26,560 U
Learning Objective 8 Provide additional information about the sales-quantity variance by calculating the market-share variance and the market-size variance.