Download
1 / 40
560 likes | 1.34k Views
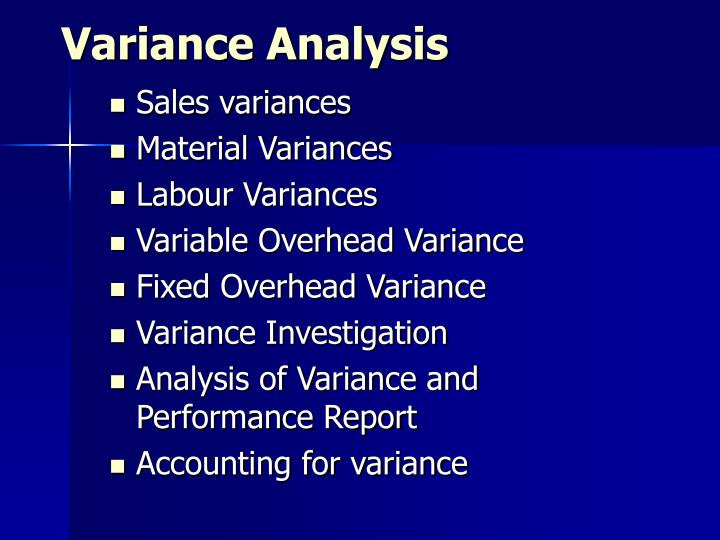
Variance Analysis. Sales variances Material Variances Labour Variances Variable Overhead Variance Fixed Overhead Variance Variance Investigation Analysis of Variance and Performance Report Accounting for variance. Total Budget Variance.

E N D
Variance Analysis • Sales variances • Material Variances • Labour Variances • Variable Overhead Variance • Fixed Overhead Variance • Variance Investigation • Analysis of Variance and Performance Report • Accounting for variance
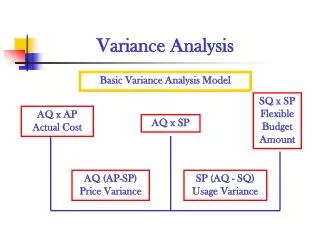
Total Budget Variance • Difference between the actual cost of the input and its planned cost • The planned input cost (flexible budget amount) is SP x SQ • Where SP = Std unit price of an input and • SQ = Std qty of inputs allowed for actual output • The actual input cost is AQ x AP • Where AP = Actual price per unit of input • AQ = Actual qty of input used
The Total Budget Variance • Can be broken into: • Price and Efficiency variance • Price (rate ) variance is the difference between actual and std unit price of an input multiplied by the number of inputs used • Usage(efficiency ) variance is the difference between the actual and standard quantity of inputs multiplied by the std unit price of the input
Sales variance • Can be used to analyse the performance of sales function or revenues centre • Calculated in terms of profit or contribution margin, not sales value
Level 2 Flexible Budget Based Variance Analysis • Static budget variance (column 1-5) • Flexible budget variance (column 1 and 3) • Sales volume variance ( column 3-5)
Sales Volume Variance for operating income • Sales Volume variance • The difference between the actual sales volume (AV) and the budgeted volume (BV) multiplied by the standard contribution margin (Budgeted SP – Budgeted variable cost per unit) • Unfavourable sales volume could be due to one or more factors such as: • Overall demand for product is not growing at rates that were anticipated • Competitors taking away market share • Poor product quality leading to customer dissatisfaction • Firm did not adapt quickly to changes in customer preferences • Did not analyse market conditions carefully when setting sales targets
Selling Price Variance • Selling price variance • Difference between the actual selling price (ASP) and the budgeted selling price (BSP) multiplied by the actual sales volume (units) • Formula: (ASP – BSP) x AV
Material Variance • Material Price variance • Formula: AQ (AP – SP) • The material price variance should be recorded at the time materials are purchased. This permits: • Early recognition of the variance • Carrying materials in inventory at standard cost • Material Usage Variance • Formula: SP (AQ – SQ)
Material Variance • Material Price Variance • May not always indicate the efficiency of purchasing department • Possible causes: a change in market condition causing a general price increase for the type of material used, failure by the purchasing department to seek the most advantageous sources of supply,purchase of inferior quality materials which may lead to inferior product quality or more wastage • Other department may be responsible for all or part of price variance
Material variance • Material Usage Variance • Normally controllable by the manager of the appropriate production responsibility centre • Common causes include; careless handling of materials, purchase of inferior quality materials, pilferage, changes in quality control requirements or changes in method of production
Labour variance • Labour Rate Variance • Formula: AH (AR – SR) • Least subject to control by management • Possible causes • Due to a negotiated increase in wage rates not yet having been reflected in the standard wage rate • A standard is used that represents a single average rate for a given operation performed by workers who are paid at several different rates
Labour variance • Labour Efficiency Variance • Formula: SR (AH – SH) • Normally controllable by the manager of the appropriate production responsibility centre • Possible causes: • Use of inferior quality materials • Different grades of labour • failure to maintain machinery • The introduction of new equipment • Changes in the production processes, poor production scheduling
Accounting for Direct Materials price and usage variance • In standard costing , all inventories are carried at standard • In recording variance: • unfavourable variance are always DEBITS • Favourable variances are always CREDITS
Accounting for Direct Materials price and usage variance • Journal entries to record the purchase of direct materials (assume unfav. MPV): • Dt Materials SP x AQ • DT MPV (AP-SP) AQ • CT Accounts Payable AP x AQ • Journal entries to record the use of direct materials (assuming an unfavourable MUV): • Dt WIP SQ x SP • Dt MUV (AQ – SQ) x SP • Ct Materials AQ X SP
Developing Budgeted Variable Overhead Cost allocation rates • Choose the period to be used for the budget • Select the cost allocation base to use in allocating variable overhead costs to output produced (eg 57,600 machine hours for a budgeted output of 144,000 jackets) • Identify the variable overhead costs associated with each cost allocation base • Compute the rate per unit of each allocation base used to allocate variable overhead costs to output produced
Actual production 10,000 jackets Cost item /allocation base Actual results Flexible Budget amount Output units 10,000 10,000 Machine hrs 4,500 4,000 Machine hrs per unit output 0.45 0.40 Variable manufacturing costs RM130,5000 RM120,000 Variable manufacturing overhead cost per machine hr RM29.00 RM30.00 Variable manufacturing costs per output unit RM13.05 RM12.00
Variable Overhead Variance • Total Variable Overhead Variance is the difference between the standard variable overhead charged to production and the actual variable overhead incurred • Overhead Spending Variance • Formula: AH (AR – SR) • Overhead Efficiency Variance • Formula: SR (AH – SH)
Columnar Presentation of Variable Manufacturing Overhead Variance Flexible budget: Budgeted input allowed for actual X Budgeted VOR Actual cost incurred Actual input(hours) x Budgeted VOR Spending variance Efficiency Flexible budget variance
Variable overhead Efficiency variance • Formula: • {actual qty of VO cost alloc. Based used for actual output –Budgeted qty of VO allowed for actual output) x BVO cost per unit of allocation base • (4500 – 0.4 x 10,000) x RM30 per hr • = RM15,000 UF
Variable Overhead Expenditure variance • Need to compare actual expenditure foe each individual item of variable overhead expenditure against the budget • Variable overhead expenditure variance is equal to the difference between the budgeted flexed variable for the actual direct labours hours of input (BFVO) and the actual overhead costs incurred(AVO)
Variable overhead spending variance • Formula: • VOSV = (actual variable overhead cost per unit of alloc. Base – Budgeted variable overhead costs per unit of alloc. Base) x actual qty of variable overhead alloc. Base • (29 –30) x 4500 • =RM4500 F
Variable overhead efficiency variance • Arise because more or less of input (direct labour hours) were required for actual production • Variable overhead efficiency variance is the difference between the standard hours of output (SH) and the actual hours of input (AH) multiplied by the standard variable overhead rate • Formula: (SH – AH) x SR
Fixed Overhead variance • Total fixed overhead variance • Fixed overhead expenditure variance • Volume variance
Example: Developing budgeted fixed overhead cost allocation rate • Given: • Budgeted total fixed overhead cost=RM3,312,000 • Budgeted output=144,000 jackets • Budgeted machine hours = 57,600 hrs • Budgeted FO cost per unit of alloc. Base • = 3312,000/57,600 = RM57.50 per MH
Columnar Presentation Fixed Manufacturing Overhead Variance Analysis Flexible Budget: Same Budgeted Lump sum regardless of Output (Budgeted F.Overhead) Allocated: Budgeted input Allow. for actual output x Budgeted FOR Actual Fixed Overhead incurred Spending variance Volume variance Flexible budget variance
Volume variance • Seeks to identify the proportion of the total fixed overhead variance that is due to the actual production being different from the budgeted production • Actual less than budgeted production, volume variance is adverse • Formula: (AP – BP) x SR AP= actual production BP= budgeted production SR= standard fixed overhead rate
Production –volume variance • Formula: • Budgeted FO – FO allocated using budgeted input allowed for actual output units produced
Volume variance • Possible causes: • Shift in demand for products • Labour disputes • Material shortages • Labour inefficiency • Poor production quality
Volume Capacity Volume • Failure to utilised the planned capacity • Formula: (AH – BH) x SR AH=Actual hours of input BH=Budgeted hours of input SR= standard fixed overhead rate Possible reasons for adverse variance: machine breakdowns, material shortages, poor production scheduling, labour disputes and reduction in sales demand
Direct Material Mix and Yield Variance • Input standards should be established (through laboratory and engineering studies) to indicate the target mix of materials required to produce a unit or specified number of units of output. • Deviations from the standard mix of input materials can affect the yield and cost per unit of output. • Computation of the mix and yield variance to provide the indication of the cost of deviating from the standard mix.
Mix Variance • Arises when the mix of materials used differs from the predetermined mix included in the calculation of the standard cost of an operation • Unfavourable variance when larger than the standard proportion of more expensive materials is used • Favourable variance when a larger proportion of cheaper materials is included in the mixture
Mix Variance • Example: Milano Sdn Bhd has established the following standard mix for producing 9 litres of product A: 5 litres of material X @ RM7/litre RM35 3 litres of material Y @ RM5/litre RM15 2 litres of material Z @ RM2/litre RM4 RM54 A standard loss of 10% of input is expected to occur. Actual input was: 53000 litres of X @ RM/litre RM371,000 28000 litres of Y @ RM5.30/litre RM148,400 19000 litres of Z @ RM2.20/litre RM41,800 Actual output for the period was 92,700 litres of product A.
Mix Variance • Formula: (actual quantity in std mix proportions –actual quantity used) x standard price Actual usage in std proportions: X=50,000 (5/10 x 100,000) @ RM7 350,000 Y=30,000 (3/10 x 100,000) @ RM5 150,000 Z=20,000 (2/10 x 100,000) @ RM2 40,000 540,000 Actual Usage in actual proportions: X= 53000 litres@ RM7 371,000 Y= 28000 litres@ RM5 140,000 Z= 19000 litres @ RM2 38,000 549,000 Mix variance RM9000 A
Yield Variance • Arise because there is a difference between the standard output for a given level of inputs and the actual output attained • Formula: (actual yield – std yield from actual input of material) x std cost per unit of output
Yield Variance Expected Yield from each 10 litres of input = 9 litres of output Std cost for this output = RM54 Std cost for 1 litre of output= 54 x 1/9 = RM6 • Yield variance = 6 x 2700 = RM16200 Favourable Or (92700 – 90,000) x 6 = RM16200 F
Variance Investigation • Which variances should be investigated? • Very expensive and time consuming to investigate all variance • Investigate only those variances that yield benefits in excess the cost of investigation
Variance Investigation • Investigation models : • rule of thumb (arbitrary criteria), • statistical model (compute probability that a given variance comes from an in control distribution , does not take into account the cost and benefits of investigation ) • Statistical decision model
Variance Investigation • Reasons why actual performance differ from standard performance • Measurement errors(error in measuring the actual outcome) • Out of date standards (due to changes in production conditions) • Out of control operations(efficient or inefficient operations) • Random or uncontrollable factors(chance fluctuation for which no cause can be found)
Variance Investigation • Decision Criteria for Investigating Variance • An investigation should be undertaken only if: • The variance is material (significant) I.e it falls outside an acceptable range • The anticipated benefits are greater than the expected costs