Download
1 / 15
150 likes | 304 Views
Figure 1 : 26 of June 2002 laboratory flux experiment 300m. TON. non. -. stirred experiment. 5. (µ M). 4. (µ M). 3. 2. TON. y. =. 0. 7836. x. -. 29331. 1. ). /. l. 2. R. =. 0. 9703. 0. 26. -. יוני. 27. -. יוני. 28. -. יוני. 29. -. יוני. 30. -. יוני. 01.

E N D
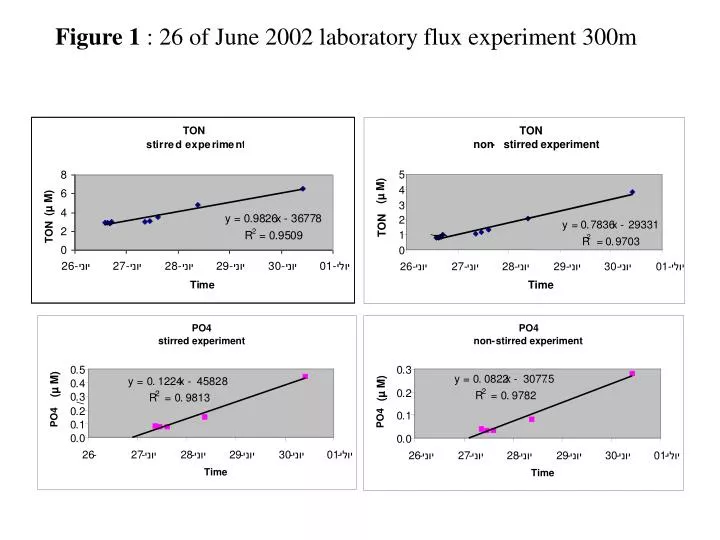
Figure 1 : 26 of June 2002 laboratory flux experiment 300m TON non - stirred experiment 5 (µ M) 4 (µ M) 3 2 TON y = 0 . 7836 x - 29331 1 ) / l 2 R = 0 . 9703 0 26 - יוני 27 - יוני 28 - יוני 29 - יוני 30 - יוני 01 - יולי Time PO 4 PO 4 stirred experiment non - stirred experiment 0 . 5 0 . 3 y = 0 . 0822 x - 3077 . 5 y = 0 . 1224 x - 4582 . 8 (µ M) 0 . 4 (µ M) 0 . 2 2 2 R = 0 . 9782 0 . 3 R = 0 . 9813 / 4 4 0 . 2 0 . 1 PO PO 0 . 1 0 . 0 0 . 0 26 - 27 - יוני 28 - יוני 29 - יוני 30 - יוני 01 - יולי 26 - יוני 27 - יוני 28 - יוני 29 - יוני 30 - יוני 01 - יולי Time Time
Table 2:Flux calculations, 300mJune 26 2002, 3 days incubation
Figure 2: Flux Experiment with sediments from 600m, July 2002 (µ M) (µ M) 12 days incubation (open) (µ M) (µ M)
Table 3: Flux calculations 600mJuly 15, 2002, 12 days incubation
Figure 3: Flux Experiment with sediments from 400m, July 2002 (µ M) (µ M) 12 days incubation (open) (µ M) (µ M)
Table 4: Flux calculations 400mJuly 15, 2002, 12 days incubation
Figure 4: Flux Experiment with sediments from 200m, July 2002 (µ M) 12 days incubation (open) (µ M)
Table 5: Flux calculations 200mJuly 15, 2002, 12 days incubation
Table 6: Flux 56m Fish FarmsOctober, 2003, 7 days incubation
Fig. 6: Pore water concentrations of reactive phosphate and ammonium in the N. Gulf of Eilat. Red squares represent the bottom water concentrations.
Fig. 7: Si/N ratio in l Flux experiments in the N. Gulf of Eilat
Fig. 7: Si/N ratio in l Flux experiments in the N. Gulf of Eilat