Download
1 / 29
290 likes | 445 Views
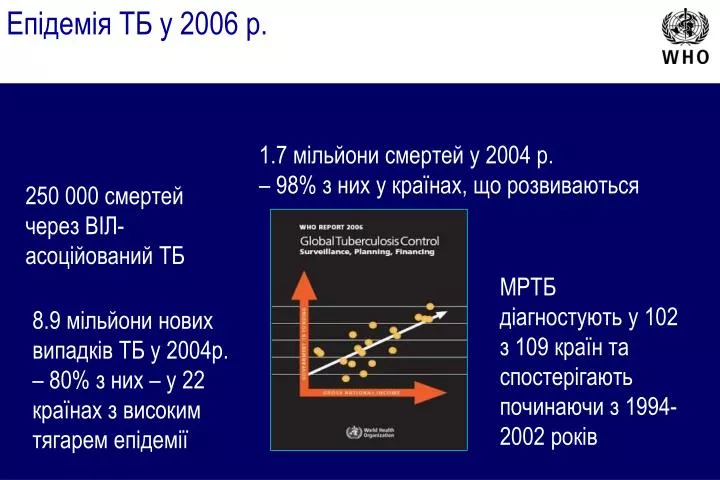
Епідемія ТБ у 2006 р. 1.7 мільйони смертей у 2004 р. – 98% з них у країнах, що розвиваються. 250 000 смертей через ВІЛ-асоційований ТБ. МРТБ діагностують у 102 з 109 країн та спостерігають починаючи з 1 994-2002 років.

E N D
ЕпідеміяТБ у 2006р. 1.7 мільйони смертей у 2004 р. – 98% з них у країнах, що розвиваються 250000 смертей через ВІЛ-асоційований ТБ МРТБ діагностують у 102 з 109 країн та спостерігають починаючи з 1994-2002 років 8.9 мільйони нових випадків ТБ у 2004р. – 80% з них – у 22 країнах з високим тягарем епідемії
У країнах Азії найвищій рівень виявлення нових випадків спостерігається підвищення активності ТБ і у Європі... 0 - 999 1000 - 9999 10 000 – 99 999 100 000 - 999 999 1 000 000 or more No estimate Estimated number of new cases (all forms) ПІВН. ТА ПІВД. АМЕРИКА 4% КРАЇНИ СЕРЕДЗЕМНОМОР’Я. 7% ЄВРОПА 5%
Кількість нових випадків в глобальному масштабі щорічно збільшується на 1% через ріст в Африці та Східній Європі Світ за виключенням Африки, Сх.Європи Африка – з високим рівнем ВІЛ 400 300 Африка – з низьким рівнем ВІЛ 200 Світ Оціночний рівень випадків ТБ/100K/yr Східна Європа 100 0 1990 1995 2000 2005
Європейський регіон ВООЗ 53 країни 18 країн найвищого пріоритету з ТБ 25 країн Євросоюзу
Реєстрація випадків ТБ у Європі, 1980-2004 Щорічна кількість випадків ТБ на 100000 населення 295,240 Схід + Європа (18 країн) 354,954 Вся Європа (53 країни) 373,497 54,231 ЄвроСоюз (25 країн) Роки
Кількість нових випадків ТБ у Європі 50/100000 – загальний рівень нових випадків ТБ у Європі • 13/100 000 – у перших 15 країнах-членах ЄС • 27/100 000 – у нових 10 країн-членів ЄС (розшиення у 2004) • 53/100 000 – чотири країни – асоційовані члени ЄС • 98/100 000 – країни, що межують з ЄС
Середній щорічний приріст випадків ТБ, 2000-2004 % зміни Немає даних / <60 випадків/рік -11% до -3% -2% до +1% +2% до +6% >+6% EuroTB
Андорра Мальта Монако Сан Маріно % випадків неєвр. походження Немає даних 0-4 5-19 20-39 40+ Відсоток випадків ТБ неєвопейського походження, 2004 EuroTB
Глобальні цілі щодо контролю за ТБ 2015:50% зменшення поширення та сметності від ТБ до 2015 2015:Ціль 6: Протидіяти ВІЛ/СНІДу, малярії та іншим захвоюванням Ціль 8: зупинити зростання до 2015 та досягти зменшення нових випадків… Індикатор 23: поширення та смертність викликана ТБ Індикатор 24: доля випадків ТБ, виявлена та вилікована за DOTS 2005:Світова Асамблея Охорони Здоров’я: - Виявити щонайменше 70% випадків ТБ відкритої форми - Успішно вилікувати 85% виявлених випадків
населення (%) без DOTS < 10 10-90 > 90 DOTS в Європі 1995 - 6 країн; 2004 - 43країни, 47% населення
TARGET План Стоп ТБу Східній Європі: досягнення • СТОПТБ стратегія: • DOTS • МРТБ, ТБ/ВІЛ, в’язниці • Система охорони здоров’я • Всі надавачі послуг • ACSM, населення, пацієнти • Дослідження Примітка: досягнення DOTS у легеневому БК+ ТБ
% легеневого ТБ 60% Молдова Киргистан 45% Арменія Грузія 30% Казахстан Туркменістан Азебайджан 15% 1999 2000 2001 2002 2003 2004 Доля легеневого ТБ з БК+, Схід*, 1999-2004 * Враховуючи країни, де класифікація легеневого ТБ застосовувалася послідовно потягом трьох і більше років
Результати лікування, нові випадки легеневого ТБ*, 2003 * БК+ у культурі, ЄС та Захід, Центральний регіон; БК+ у мазку, Македонія та Схід. Країни з загальнонаціональними показниками; за виключенням 4 країни з кількістю випадків < 10 (ЄС & Захід) § Середнє значення (коливання вказано у дужках) EuroTB
Outcomes among new, definite pulmonary TB cases, EU & other regions, 2003* Despite low mortality rates, the proportion of TB patients notified in the EU who die while on treatment is substantial, even when compared to other regions in the world. This is one limitation keeping many EU countries from achieving the WHO target of 85% success among previously untreated pulmonary TB cases. * Mean for 19 EU countries (EuroTB); data from other regions refer to DOTS cohorts (WHO Global Tuberculosis Control: Surveillance, Planning, Financing. 2006)
East – West divide EuroTB
Why the new Stop TB Strategy ? Vision, Goals, Objectives Vision:A WORLD FREE OF TB Goal:To dramatically reduce the global burden of TB by 2015 in line with the MDGs and the Stop TB Partnership targets Objectives: • Achieve universal access to high-quality diagnosis and patient-centred treatment • Reduce the human suffering and socio-economic burden associated with TB • Protect poor and vulnerable populations from TB, TB/HIV and multidrug-resistant TB • Support development of new tools and enable their timely and effective use
What are the main challenges ? • DOTS not yet fully expanded and of high quality everywhere • TB/HIV, especially in Africa, and MDR-TB, especially in former USSR and China • Weak health systems and services impeding proper TB control and care • Not all practitioners engaged • Communities un-aware and un-involved • Research not producing yet new tools and outside of the interest of TB "controllers"
Western and Central Europe • Today, mainly sexual transmission in Western and Central Europe • Exceptions: significant IDU epidemics in ESP, POR, ITA, SWI, POL • 25-65% of all cases are among MSM • Up to 75% of all heterosexual cases are among immigrants from high prevalence countries and women are >50% of all heterosexual cases • Vulnerable Groups: MSM & immigrants, specially immigrant women
Eastern Europe • Mainly IDU related transmission in Eastern Europe • 68-85% of all cases are male • Up to 30% of infected females are IDU and 50% are partners of IDU • 30-50% of all HIV infections are among those under 25 years • Vulnerable Groups: IDU, sex workers, prisoners, ethnic minorities, migrants
<20% 20-40% 40-60% 60-80% >80% 10% 84% 6.1% 6% 13% 2% 50% IDU as % of all HIV/AIDS casesNOTE: % of AIDS cases in countries not reporting HIV Sources: EuroHIV; national reports; 11% 0% 25.5% 19.4% 17% 14.5% 87% 16% 90% 34% 81% 83% 6% 71% 82% 80% 16% 24% 5% 71% 29% 29% 82% 20% 2% 74% 86% 16% 32% 7% 64% 11% <1% 15% 51% 60% 68% 4% 60% 14% 3% 57% 5% 8.2% 16% 1.8% 16%
<20% 20-40% 40-60% 60-80% >80% 72% 76% 76% 61% 78% 85% 83% Males as % of all HIV/AIDS casesNOTE: % of AIDS cases in countries not reporting HIV Sources: EuroHIV; national reports; 78% 62% 25.5% 75% 71% 75% 75% 16% 77% 68% 73% 89% 78% 71% 63% 79% 81% 81% 80% 66% 61% 80% 84% 85% 73% 72% 80% 97% 80% 80% 63% 90% NA 74% 77% 71% 69% 80% 72% 82% 78% 80% 70% 83% 64%
Access to HAART, 03/2003 RUS EST LAT LIT BEL UKR KAZ MOL ROM GEO UZB KYZ BUL AZE ALB ARM TKM TJK TUR BIH, FYM, YUG no HAART (<1%) good coverage (>70%) poor access ( 1-10%)partial coverage (10-70%)
Access to HAART, 01/2006 RUS* BEL UKR* KAZ* UZB* AZE* ARM* TKM TJK* no HAARTvery poor coverage ( 1-10%) * in the process of scaling up ART poor coverage (10-50%) moderate coverage (50-75%) disputed coverage estimates or insufficient data available good coverage (over 75%)
HIV infection among TB cases, 1998-2004* The proportion of TB cases with HIV infection has increased in Estonia and Latvia, but is still highest in Portugal and Spain. In other countries of the Balkans and East providing data, levels have remained below 1%. * Excluding countries with less than 2 datapoints in the last 3 years or less than 50 TB notifications annually
Reported to WHO (2005) 52,800 TB patients HIV tested 5,800 tested positive 14 started the ART
Estimated HIV prevalence 2005 % HIV prevalence estimated in general population and TB patients (adults) Source: UNAIDS (2004); WHO Global TB Report (2006)
European Framework for TB/HIVInterim policy on collaborative TB/HIV activities • Establish the mechanism for collaboration • Set up a coordinating body for TB/HIV • Conduct surveillance of HIV prevalence among TB patients • Joint TB/HIV planning • Conduct monitoring and evaluation • Decrease the burden of TB in people living with HIV/AIDS • Intensified TB case finding • Introduce INH preventive therapy • Ensure TB infection control in health care and congregate settings • Decrease the burden of HIV in TB patients • Provide HIV testing and counselling • Introduce HIV prevention methods • Introduce co-trimoxazole preventive therapy • Ensure HIV/AIDS care and support • ART
Cat 1: national adult HIV prevalence >1% or HIV prevalence in TB pts >5%: all activities recommended in the Interim policy to be considered for implementation • Cat 2: national adult HIV prevalence below 1% and administrative areas with adult HIV prevalence >1% - combination of Cat 1 and Cat.3 • Cat 3: national adult HIV prevalence below 1% and no administrative areas with adult HIV prevalence >1%: • Conduct surveillance of HIV prevalence among TB patients • Decrease the burden of TB in people living with HIV/AIDSwith focus on groups at high risk for TB and HIV – IDUs, MSM, sex workers, those living in congregate settings)