Download
1 / 39
420 likes | 599 Views
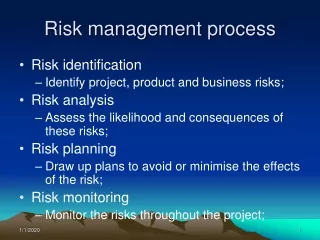
R isk analysis for improving production ramp-up. Bassetto 1 , Mili 1 , Siadat 2 , Tollenaere 1. 1. 2. Outline. I E P. I ndustrial context and question E nterprise risk audit – practices analyses P roposition & on going subject. Industrial context of this research. I E P.

E N D
Risk analysis for improving production ramp-up Bassetto1, Mili1, Siadat2, Tollenaere1 1 2
Outline I E P Industrial context and question Enterprise risk audit – practices analyses Proposition & on going subject
Industrial context of this research I E P • In semiconductor industry: ‘FE techno’ • One new product generation: a technology • 2 years of development (Engineering) • 30 Development engineers • 1 techno 1B€ • Commercial windows : From 2 to 5 years
technological context I E P • From 120nm To 32nm techno Master 1,2nm +/- Å, Metrology tools @ 0,1 Å! • Billion of times / wafer & 2.103 to 4.103 w/w 1,2nm +/- Å >1E10 times Number > 107/chip Number > 103C/Wafer
Industrial context I E P • Over 400 Process Operations • Around 2 months to 1 full wafer • 1 Fab Over than 40K Control Charts
Industrial context I E P Semiconductor industries [Benfer, 96]
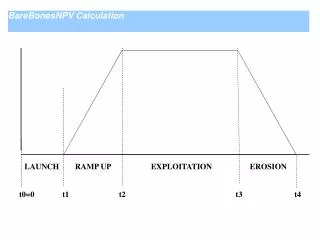
Stakes Production life cycle in Semiconductor industries Production size I E P Yield Production volume max 100 % industrialization Launch, 1 year Maturation 1 year Production, 2 years Stop, 3 years Time Production Transfert and stop Launch Maturation
Learning Curves – eg on quality I E P • Several scenarios for quality managment: WIP WIP volume volume NC NC t Case 1 t Case 2 WIP WIP volume volume NC NC t Case 4 Case 3 t
Research quest: I E P How being systematically in the case 3 or better ? Before the ramp-up, risks are potentials (being known or not). During it, they become real events and reduce performance. How prevent and mitigating them in a reliablemanner?
Outline I E P Industrial context and question Enterprise risk audit – practices analyses Proposition & on going subject
Enterprise Description I E P • A best in class manufacture • ISO/TS • ISO 14001 • Non conformity Mgt, Customer Claims, Preventative & Predictive maintenance, Powerfull Process control, effective FMEA, Functional & Used Electronic Documentation, a cuting edge R&D…
Risk management status I E P • Risk management methods & tools are not connected
Risk management status I E P • What happened when IS are not connected… Eg. 2
The lack of links between risk management processes (1/2) I E P • Experts are thinking that Extract from the Preliminary analysis of a tool 1 occurrence MAX each an !
The lack of links between risk management processes (2/2) I E P • Facts Underline an other reality for the « Wafer aligner » element 3 occurrences over 13 weeks 12 per year: If FMEA have been updated RPN ranking grow up from 10 to 25 ‘OCC’ will pass from 2 to 5
Risk management status W L E S L E S • Risk management not uniform Action plan coherency ? Risked zone of the process ? Coherency on ctrls ?
Outline I E P Industrial context and question Enterprise risk audit – practices analyses Proposition & on going subject
Risk management status I E P • Risk management not uniform
Risk management proposition I E P • Need of information update => info reliability
Results (1/3) I E P • Toward a more « rational » organization 15000 Risks analysed in 3 main organizations, involving more than 600 Engineers Passed 5 customers Audit with success Updates are performed: • Automatically for process NC, • Automatically unsched event on tool • Manually for Scraps (After team problem solving close its actions)
Reusing risks analysis for technology assessment I E P • One central risk database for every technology developement.
4) Reusing risk analyses for technology assessement I E P • Already used for CMOS120, CMOS90, CMOS 65 ramp-up and reliability analysis
Impact on operations scraps I E P • More than 1 year of Yield data Still massive scraps improvement
Results (3/3) - summary I E P • Local improvement: Organizational improvement satisfactory • Customer feedback very positive • Learning on going: ROI achieved @ the first lot saved ! • Global plant improvement: Learning curve still NOT satisfactory • Confidence in analyses can theorically be improved however many difficulties are encountered. (HR issues also to reduce fire fighting)
Outline I E P Industrial context and question Enterprise risk audit – practices analyses Proposition & on going subject
Main issue for linking risks and manufacturing ctrl plan One new central question: how to get process model? I E P • What is f ? Process Measured Outputs: O (Product parameters) Measured Inputs: I (Prod operation) Measured Internal Variables: V (control parameters) O = f(I,V)
2) How to get more robust control plans ? Levels of controls I E P How to find holes in the ctrl plan ? Links between risks analyses and control plans Visual inspection détection Impacting events
3) Update loop improvement (1/2) I E P 1 PhD Student Aymen MILI • How to get the loop more effective ?
3) Update loop improvement (2/2) I E P 1 PhD Student Aymen MILI • How to get the loop more effective ?
Risk management processes audit (1/3) @ STMicroelectronics I E P
Risk management processes audit (2/3) @ STMicroelectronics I E P
Risk management processes audit (3/3) @ STMicroelectronics I E P
5 procedures of risks managment held by 5 different organizations All these procedures are isolated from each others Audit Conclusions @ STmicro. I E P
Learning Curves – eg on quality I E P Case 5 • A more realistic scenario: WIP volume NC t WANTED ON NC : 1) NO SLOPE 2) LESS VARIATIONS
1) The point of view vs risk analysis I E P • Production point of view • ∞ failure modes number : • Failure modes come from a preliminary risk analysis (PRA) Prod operation PM Thickness too low Yield loss 6 Equipment drift 2 1 12 SPC, PT Parameter FDC on tool FMEA
SPC approach in the FMEA template 1) The point of view vs risk analysis I E P • The process control Point Of View • For 1 item function: 3 associated failure modes: • Variable too low • Variable too high • Variable gradien (temporal or surfacic) • Toward an AUTOMATIC RISK ANALYSIS UPDATE PT Variable to control OOC Product impact, increase scrap rate TBD PT 7 Tbd ? 6 Cpk Value
Main issue for linking risks and manufacturing ctrl plan 1) The point of view vs risk analysis I E P • Analysis is not performed • Link does not exist between product FMEA and product control plan Are our control plan coherent toward customers needs ?
Risk management status I E P • What happened when SI are not connected • Every change impact, difficult to evaluate • Multiplicaiton of way to control the process and stop the process • No clear vision of control efficiency • It is not necessary to add cameras on highways to reduce speed if deadly accidents are in national roads ! • Multiplication of action plan => dispersion of working teams • Multiplication of SI to analyse the process • Control is no more a question of facts but people lobbying