Download

1 / 28
280 likes | 290 Views
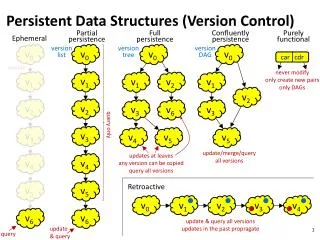
Deborah Gore, September 26, 2016. PERCS Update. The Numbers. 113 Active PT programs 80 Full 33 Modified 626 Active SIUs 34% Metals 14% textile 11% food processors 5 % pharmaceuticals 5% laundries 4% OCPSF. PERCS Accomplishments. 9/1/15 – 8/31/16 Assisted with 15 audits/PCIs

E N D
Deborah Gore, September 26, 2016 PERCS Update
The Numbers • 113 Active PT programs • 80 Full • 33 Modified • 626 Active SIUs • 34% Metals • 14% textile • 11% food processors • 5 % pharmaceuticals • 5% laundries • 4% OCPSF
PERCS Accomplishments • 9/1/15 – 8/31/16 • Assisted with 15 audits/PCIs • 3 new modified programs • 167 IUP drops, mods, renewals, new • 9 ERPs • 37 HWAs • 17 IWSs • 25 Monitoring Plans • 3 SUOs • 15 NPDES request for PT information
PERCS Accomplishments Two – Industrial User Permit Writing Workshops (IUP) Two – Pretreatment Annual Report Workshops (PAR) Three Headworks Analysis Workshops (HWA)
Assignments & Contact Info. • Monti Hassan 919-807-6314 • Chowan, Hiwassee, Little Tennessee, Lumber, Neuse, New, Roanoke, Yadkin • Sarah Bass 919-807-6310 • Broad, Cape Fear, Catawba, French Broad, Tar-Pam Email: FIrstName.LastName@ncdenr.gov
Enforcement • QNCR = Quarterly Noncompliance Report • Level 1 • Failure to take effective enforcement for pass through or interference • Failure to submit (over 30 days late) • Failure to meet milestone (over 90 days late) • Level 2 • Failure to issue IUPs for at least 90% • Failure to sample or inspect at least 80% • Failure to enforce standards or reporting requirements • Any other violation that State or EPA considers to be of substantial concern
Enforcement • 2 Programs on QNCR • Failure to renew IUPs • Failure to take adequate enforcement
2007-2014 Triennial Review Rules • November 13, 2014 – Approved by EMC • April 6, 2016 – Approved by EPA (with some exceptions): • Adoption of instream dissolved metal water quality standards (acute and chronic) • Adoption of 1Q10 streamflow dilution for implementation of acute water quality criteria • Deletion of total metal aquatic life criteria for chromium, iron, manganese • EPA disapproval of Action Level Policy for copper, silver, zinc Department of Environmental Quality
NC Dissolved Metals Water Quality Standards/Aquatic Life Protection Department of Environmental Quality
NPDES Implementation Procedures EPA Region IV and NC DWR NPDES Permitting agreed on Implementation Procedures for Instream Dissolved Metal Standards. This included: • Using instream data collected upstream of the discharge as opposed to 8-Digit HUC data • Using the mass balance of the average upstream hardness and average effluent hardness to determine the combined hardness to be used in the hardness dependent standards equations • Using a hardness floor of 25 mg/l and ceiling of 400 mg/l (100 mg/l for water supply) • Using approved EPA translators to convert from the dissolved to the total recoverable metals - Or approved site specific translators if available. • Using the effluent hardness if the receiving stream does not have a positive 7Q10.
Permitting - RPA Hardness-Dependent Metals - Freshwater Department of Environmental Quality Reasonable Potential Analysis (RPA) is used – • To determine the need for water quality based effluent limits • To estimate the 95th percentile upper concentration of each pollutant • To calculate the allowable effluent concentration (permit limit) for each pollutant Information needed to perform RPA - • 7Q10, critical low flow • Effluent hardness and upstream hardness • Permitted flow • Receiving stream classification • Combined hardness is calculated as follows: (Permitted flow, cfs * avg effluent hardness, mg/l) + (7Q10, cfs * avg upstream hardness, mg/l) (Permitted flow, cfs + 7Q10, cfs)
Metals Calculator – Option 2 http://deq.nc.gov/about/divisions/water-resources/water-resources-permit-guidance/npdes-industrial-stormwater/metals-calculators/option-2 Department of Environmental Quality The NPDES Metals Calculators can be found at the following link listed below.
TABLE B Use as stream std. Use as permit limits C HQW Department of Environmental Quality
Current allocation table Department of Environmental Quality
Potential Allocation Table Department of Environmental Quality
Potential Allocation Table Department of Environmental Quality
Typicalville • Permitted flow = 13.5 MGD • 7Q10 = 239 MGD • Copper & lead down 50%; silver down 98%, but no over allocations • IF instead 7Q10 = 0 • Typicalville’s potential NPDES limit = 7.9 ug/l; MAHL = 1.57 pounds • Uncontrollable = 7.5 pounds • Typicalville’s actual influent copper = 180 ug/l (10.75 pounds) • Site specific removal rate = 70%; 54 ug/l at effluent • Literature removal rate = 86%; 25.2 ug/l at effluent • Would need removal rate = 95.6%; 7.9 ug/l at effluent
What you should do now • Collect upstream and effluent hardness data • Go to the calculator and find out your potential NPDES limits • Compare those potential limits to your effluent data • Non-compliant? • Request a compliance schedule • Enter the new limits into the HWA spreadsheet • Over allocated? • Check removal rate • Check uncontrollable concentration • Review SIU limits
Chromium Total chromium standard replaced with trivalent chromium (Cr III) and hexavalent chromium (Cr VI) standards in freshwater. Total Cr = Cr III + Cr VI Total Cr can be measured to 5 µg/L Cr VI can be measured to 50 µg/L (as dissolved) Cr III can not be measured, it is calculated (Cr III= Total Cr – Cr VI) Therefore, total chromium effluent data may be used as a conservative surrogate. Permittees with total Cr effluent data showing no reasonable potential to exceed Cr VI or Cr III allowable discharge concentrations will not get limits for Cr VI or Cr III.
PQL’s In accordance with 2B Surface Water Quality Standards – All data generated must be reported to the approved detection level or lower reporting level of the procedure. DWR NPDES requests that POTW’s report effluent concentrations for – Cadmium to 0.5 µg/L, and Silver to 1 µg/L Reporting lower levels result in less of a chance of showing reasonable potential (ie. receiving a limit or monitoring requirements)! Suggested DWR metal PQL’s can be found on the DWR website under the Water Sciences Section – Inorganic Chemistry.
Practical Quantitation Levels Arsenic -2.0 µg/L Cadmium – 0.50 ug/l Chromium - 10 µg/L Copper – 2.0 µg/L Lead - 2.0 µg/L Mercury – 1.0 ng/L (EPA Method 1631E) Molybdenum - 10 µg/L Silver – 1.0 µg/L Selenium - 5.0 µg/L Zinc - 10 µg/L *Red Highlighted are lower than the current model LTMP/STMP
Dental Amalgam • Final rule delay until December, 2016 • EPA call in July • Comments mostly regarding burden and costs • DIU vs SIU not clear • Looking at ways to reduce burden • About modifying behavior of dentists • Non-delegated towns? - no specific enforcement regime • No issues at WWTP – hard to make POTWs regulate dentists • How is success measured if all non-detects?
Coal Ash Leachate • Coal ash leachate disposal at WWTP • Existing source • POCs for 40 CFR 423 – Steam Electric Power Generating • Data from airport fill projects – permitted by DWM • RECOAL - Reintegration of coal ash disposal sites and mitigation of pollution in the West Balkan Area • University of Illinois - Elemental characterization of coal ash leachates • Electric Power Research Institute - Coal Ash; Characteristics, Management and Environmental Issues
Interconnectivity • Expanding pharmaceutical industry • Town building pretreatment system • BOD reduction • Flow issues • Agreements with 2 other POTWs – flow going 3 different ways; multiple disposal patterns • PERCS, RRO, Town and Partner developed plan for continued growth
NCAC 2H .0900 Pretreatment Rules • Meetings with Secretary’s office • Incorporation by reference • Subsequent revisions • Waste reduction activities
E - Reporting • Phase 1 – December 21, 2016 • DMRs – still have to submit paper, too • Inspection, violation determination and enforcement action data shared electronically • 364 fields not captured or unable to transmit • Implementation plan for phase 2 • Phase 2 - December 2020 • Pretreatment Annual Reports • State wants to be the initial recipient • No mechanism for EPA to accept • No mechanism for State to send NPDES Wastewater / HOT TOPICS / e-DMR https://deq.nc.gov/about/divisions/water-resources/edmr