Download
1 / 49
490 likes | 561 Views
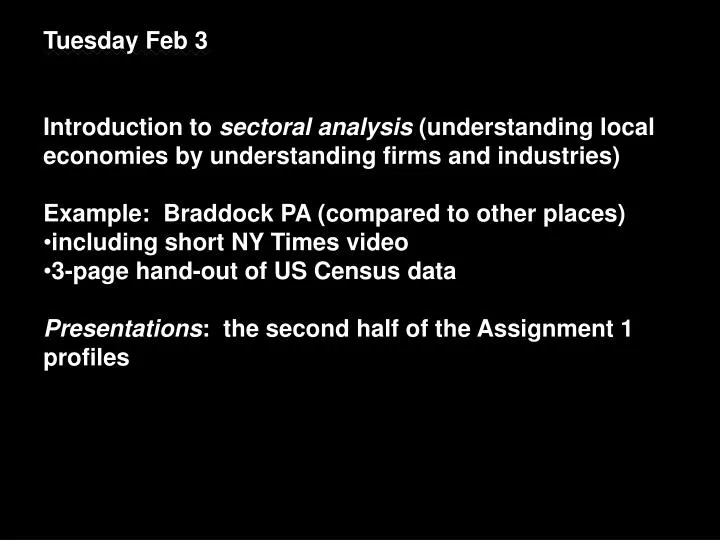
Tuesday Feb 3 Introduction to sectoral analysis (understanding local economies by understanding firms and industries) Example: Braddock PA (compared to other places) including short NY Times video 3-page hand-out of US Census data

E N D
Tuesday Feb 3 • Introduction to sectoral analysis (understanding local economies by understanding firms and industries) • Example: Braddock PA (compared to other places) • including short NY Times video • 3-page hand-out of US Census data • Presentations: the second half of the Assignment 1 profiles
Feb 3: Introduction to Sectoral Analysis + Data Sources • Industry vs. occupation • Typology/classification of sectors • Industry trends: growth and decline Feb 5: Economic Base, Multipliers, Location Quotients • What is the relative concentration of a sector in a location? • What is the link between export and non-export activity? • How do changes in one activity affect another activity? Feb 10: Shift-Share and the Analysis of Industrial Mix • How do we isolate the employment change into three elements: national changes, sectoral changes, relative competitiveness? Feb 12: Economic Geography, Location Theory and Theories of Firm Location • Why do firms start, relocate, close based on geography?
Feb 3: Introduction to Sectoral Analysis + Data Sources • Industry vs. occupation • Typology/classification of sectors • Industry trends: growth and decline Feb 5: Economic Base, Multipliers, Location Quotients • What is the relative concentration of a sector in a location? • What is the link between export and non-export activity? • How do changes in one activity affect another activity? Feb 10: Shift-Share and the Analysis of Industrial Mix • How do we isolate the employment change into three elements: national changes, sectoral changes, relative competitiveness? Feb 12: Economic Geography, Location Theory and Theories of Firm Location • Why do firms start, relocate, close based on geography?
The organization of economic activity: • A range of perspectives include…. • Institutional typologies – how business activity organizes itself • Analytical typologies – how scholars understand economic activity • Regulatory typologies – how government regulates, manages, taxes economic activity • Micro vs. macro approaches • And do you focus on • the nature of work (e.g., occupations, skills) • The nature of output (e.g., products) • The relationship to the means of production (e.g., employee, employer) • Geography (location) I. Units of analysis include… Employees/workers occupations Establishments Firms Industries/sectors Industrial clusters Local and regional economies National economies II. III.
Markusen, Ann. 1994. Studying Regions by Studying Firms. The Professional Geographer 46 (4):477-490. Terms: Establishments Firms Industries regions
establishment establishment Establishment Vs. Firm Each polygon = establishment Shape = industry Color = firm establishment establishment Multi-establishment firm C Multi-establishment firm A establishment region establishment establishment establishment establishment establishment Multi-establishment firm B establishment
Chinitz, Benjamin. "Contrasts in Agglomeration: New York and Pittsburgh," in Readings in Urban Economics, edited by Matthew Edel and Jerome Rothenberg. New York: Macmillan Company, 1972, pp. 90-104
Chinitz, Benjamin. "Contrasts in Agglomeration: New York and Pittsburgh” Areas of difference between the two cities: Size Industrial structure Rate of growth
Entrepreneurship Capital Labor Intermediate goods and services Areas of difference between the two cities: Size Industrial structure Rate of growth
It should be apparent by now that what I am reaching for is the specification of a function which relates external economies and diseconomies to industry structure, size being held constant. My feeling is that we have been too prone to associate external economies and diseconomies with size. We have been disturbed at not being able to derive a satisfactory correlation between the two. What I have tried to do is explore some of the residual variation around the size function.
It should be apparent by now that what I am reaching for is the specification of a function which relates external economies and diseconomies to industry structure, size being held constant. My feeling is that we have been too prone to associate external economies and diseconomies with size. We have been disturbed at not being able to derive a satisfactory correlation between the two. What I have tried to do is explore some of the residual variation around the size function. size • Access to capital • Entrepreneurship • More dynamic labor market • Culture of risk-taking and innovation Rate of regional growth Industrial structure diversification
efficiency innovation Increased profitability due to lowering the per unit cost of producing the same item due to producing existing items in new, better ways (process innovation) or producing new items (product innovation) Agglomeration Economies Can arise both from increased efficiency and innovation Spatial clusterings (e.g., cities, regions) can arise for both reasons.
Industry – what you produce (the output of your labor) often understood by knowing the employer -- use the NAISC (once SIC) Occupation – how you produce (the input of your labor) -- often understood by job title -- use the Standard Occupational Classification (SOC)
Industry – what you produce (the output of your labor) often understood by knowing the employer -- use the NAISC (once SIC) Occupation – how you produce (the input of your labor) -- often understood by job title -- use the Standard Occupational Classification (SOC) Where you work (i.e., what business) What you do at work (your tasks, skills) Defined by occupation labor inputs the firm outputs Defined by industry resources
INNOVATION Defined by occupation labor inputs the firm PROCESS INNOVATION outputs Defined by industry PRODUCT INNOVATION resources
Industry – what you produce (the output of your labor) often understood by knowing the employer -- use the NAISC (once SIC) Occupation – how you produce (the input of your labor) -- often understood by job title -- use the Standard Occupational Classification (SOC) – maintained by the BLS [link] Where you work (i.e., what business) What you do at work (your tasks, skills)
Industry – what you produce (the output of your labor) often understood by knowing the employer -- use the NAISC (once SIC) Occupation – how you produce (the input of your labor) -- often understood by job title -- use the Standard Occupational Classification (SOC) Which one is more important in determining… Wages and income Benefits (including health and retirement) Job stability Job advancement (and human capital development) Multiplier effects Geographic location of work Racial and gender and age structure of workforce
North American Industry Classification System • Old system: SIC codes (1937 – ca. 1997) • New system: NAISC (1997 - ) • Note: Some agencies still use SIC codes
North American Industry Classification System • Done by establishment (usually a single physical location) -- note: an enterprise (e.g., firm may have multiple establishments, e.g., multiple locations) • Each establishment gets assigned ONE NAICS code based on its “primary business activity” ”Ideally, the primary business activity of an establishment is determined by relative share of production costs and/or capital investment. In practice, other variables, such as revenue, value of shipments, or employment, are used as proxies. The Census Bureau generally uses revenue or value of shipments to determine an establishment's primary business activity.”
North American Industry Classification System From http://www.census.gov/eos/www/naics/faqs/faqs.html NAICS is a two- through six-digit hierarchical classification system, offering five levels of detail. Each digit in the code is part of a series of progressively narrower categories, and the more digits in the code signify greater classification detail. DIGIT 1-2 The first two digits designate the economic sector, • the third digit designates the subsector, • the fourth digit designates the industry group, • the fifth digit designates the NAICS industry, and • the sixth digit designates the national industry. The five-digit NAICS code is the level at which there is comparability in code and definitions for most of the NAICS sectors across the three countries participating in NAICS (the United States, Canada, and Mexico). The six-digit level allows for the United States, Canada, and Mexico each to have country-specific detail. A complete and valid NAICS code contains six digits.
From http://www.census.gov/eos/www/naics/faqs/faqs.html NAICS is a two- through six-digit hierarchical classification system, offering five levels of detail. Each digit in the code is part of a series of progressively narrower categories, and the more digits in the code signify greater classification detail. 1-2 The first two digits designate the economic sector, • the third digit designates the subsector, • the fourth digit designates the industry group, • the fifth digit designates the NAICS industry, and • the sixth digit designates the national industry. The five-digit NAICS code is the level at which there is comparability in code and definitions for most of the NAICS sectors across the three countries participating in NAICS (the United States, Canada, and Mexico). The six-digit level allows for the United States, Canada, and Mexico each to have country-specific detail. A complete and valid NAICS code contains six digits. Source: http://www.census.gov/prod/ec02/02numlist/m31r-nl.pdf
11. How can I have my company's NAICS code changed? There is no "official" way to have a company's NAICS code changed and there is no central register that represents the "official" NAICS classification for business establishments. Various Federal government agencies maintain their own directories of business establishments, and assign classification codes based on their own needs. Generally, the classification codes are derived from information that the business establishment has provided on surveys, forms, or administrative records. For this reason, we recommend that you contact the agency that has assigned the code that you believe should be changed. For example, if you question the NAICS code contained on a form received from the Occupational Safety and Health Administration (OSHA), you should contact the Department of Labor. For access to a list of Federal government agencies' websites, visit www.usa.gov/Agencies/Federal/All_Agencies/index.shtml .Back to top 12. How can I get a new NAICS code created for my type of business? NAICS is scheduled to be reviewed every 5 years for potential revisions, so that the classification system can keep pace with the changing economy. This is the only time that new NAICS codes can be considered. See the NAICS Update Process Fact Sheet [PDF 37K] for more information.
+ + + + + + + + + gross domestic product (GDP) -- “the output of goods and services produced by labor and property located in the United States” --BLS (Bureau of Labor Statistics) Largest increases +
Manufacturing Employment(Millions of jobs) Sources: Congressional Budget Office; Department of Labor, Bureau of Labor Statistics. Note: The vertical bars indicate periods of recession as defined by the National Bureau of Economic Research. http://www.cbo.gov/showdoc.cfm?index=5078&sequence=0
Output and Employment in the Manufacturing Sources: Congressional Budget Office; Department of Labor, Bureau of Labor Statistics; Department of Commerce, Bureau of Economic Analysis.Note: The vertical bars indicate periods of recession as defined by the National Bureau of Economic Research. http://www.cbo.gov/showdoc.cfm?index=5078&sequence=0
Source of data: http://www.census.gov/econ/census02/advance/TABLE1.HTM
Source of data: http://www.census.gov/econ/census02/advance/TABLE1.HTM
Percent Change in Manufacturing Employment by US Census Division, 1967 - 1995 -30% +22% +19% -43% -16% +115% +45% +20% +31% Sources: Bureau of Labor Statistics, Employment and Earnings; Statistical Abstract of the United States 1993 (Table No. 661); Annual Survey of Manufacturers, Geographic Area Statistics, series M95(AS)-3
example: steel Link to census
http://www.census.gov/econ/census02/ http://www.census.gov/econ/census02/data/comparative/USCS_31.HTM
Shipments per capita, Primary metal manufacturing (NAICS 331), 2002
Number of Employees, Primary metal manufacturing (NAICS 331), 2002