Download
1 / 75
1.09k likes | 1.54k Views
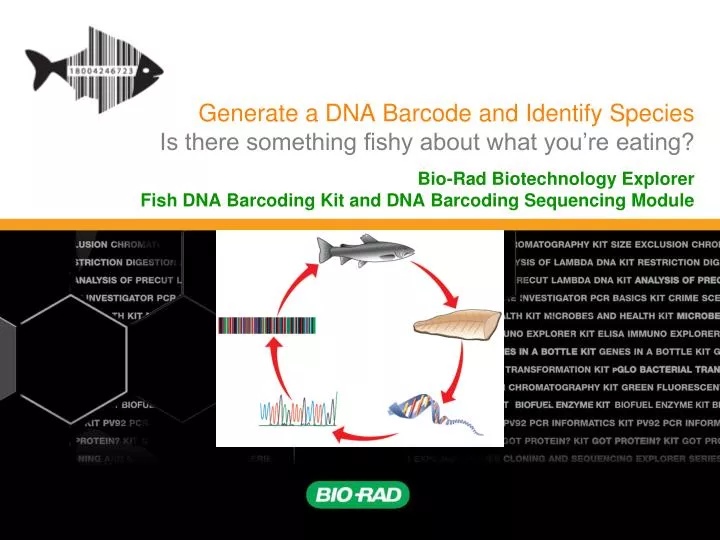
Generate a DNA Barcode and Identify Species Is there something fishy about what you’re eating?. Bio-Rad Biotechnology Explorer Fish DNA Barcoding Kit and DNA Barcoding Sequencing Module. Instructors - Bio-Rad Curriculum and Training Specialists. Damon Tighe, damon_tighe@bio-rad.com

E N D
Generate a DNA Barcode and Identify SpeciesIs there something fishy about what you’re eating? Bio-Rad Biotechnology Explorer Fish DNA Barcoding Kit and DNA Barcoding Sequencing Module
Instructors - Bio-Rad Curriculum and Training Specialists Damon Tighe, damon_tighe@bio-rad.com Sherri Andrews, Ph.D. sherri_andrews@bio-rad.com Leigh Brown, M.A. leigh_brown@bio-rad.com
Workshop Timeline Introduction Fish DNA extraction Gel electrophoresis DNA visualization with UViewTM Bioinformatics and species identification Inquiry Questions
Diversity of Life • It is estimated that there are 10 -100 million species of organisms on Earth • Only about 1.7 million species have been formally identified • Current limitation to studies of biological diversity - humans are limited in their ability to recognize and recall morphological variation • Few taxonomists can even reliably identify a collection of ~1000 species • How do we complete the task of identifying the remaining species, let alone recognizing them once they are identified? • Solution – Create a genetic based identification system (DNA barcode)
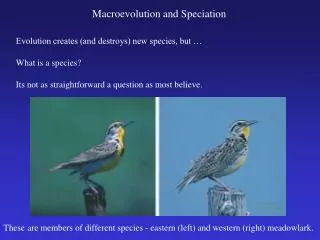
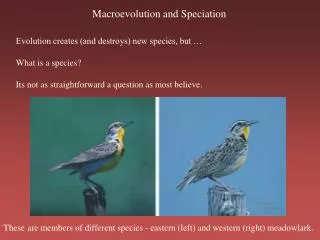
Visual Classification • Some distinct species are not easy to differentiate by eye… vs or
What is DNA Barcoding? • A worldwide effort (International Barcode of Life, iBOL) exists to “barcode” or generate standard genetic sequence identification of all species on Earth. • What is a barcode? • UPC (Universal Product Code) Symbol – 11 variable positions • with 10 possible numbers • Ability to assign a unique identifier to over 100 billion items • What is a DNA barcode? • Use of a designated DNA sequence to serve as a unique species identifier • Ideal sequence is constrained by overall conservation (preserve gene function), but still has substantial sequence variation which differentiates species CCCTCCTA
Barcode Of Life (BOL) • iBOL • International Barcode of Life Project • Hub is at Biodiversity Institute of Ontario (BIO) at U Guelph • Goal to generate 5 million barcodes representing 500,000 species • Currently: 2 million barcodes representing 300,000 species in the database • Opportunity to contribute to the global initiative to barcode life on Earth!
Be a citizen scientist! • Participate in the largest biodiversity cataloging project ever undertaken and help build a genetic registry of life • Design a market study to look at local food supply, or local flora and fauna Axolotl / Mexican salamander (critically endangered)
“Sushigate” • 2008, two 11th graders in New York did a market substitution study • Surveyed 60 samples collected from 4 restaurants and 10 grocery stores • Of the 60 samples, 54 could be genetically identified • 13 of the 54 were mislabeled (23%)! • 2/4 restaurants and 6/10 grocery stores had sold mislabeled fish
“Sushigate” • 7/9 samples listed as Red Snapper were mislabeled, and included substitutions: Acadian redfish from North Atlantic, Pinjalo from SE Asia, Lavender jobfish from So. Pacific, Nile perch from Africa, and Atlantic Cod. • Spotted Goatfish (restricted to the Caribbean) sold as Mediterranean Red Mullet • White Bass (farmed freshwater fish) sold as Sea Bass • Smelt Roe sold as Flying Fish Roe • White (albacore) tuna sushi was Mozambique tilapia (commonly farmed)
DNA Barcode Region Defined Genes Designated as Barcode Regions: • Fungi • ITS – nuclear ribosomal internal transcribed spacer region • Plants – 2 genes required • rbcL – chloroplast ribulose-1,5-bisphosphate carboxylate • matK – chloroplast maturase K • Animals • COI – mitochondrial cytochrome C oxidase subunit I • Why COI? • Mitochondrial genome lacks introns • Limited exposure to recombination • Haploid mode of inheritance • Universal primers are robust • Hundreds to thousands of mitochondria/cell – this • means many more copies of the COI gene in your sample! Mitochondrial DNA
What did I eat last night (and is it what they said it was)? What did I catch yesterday? What is the genetic signature of this rare species? Applications of DNA Barcoding
DNA BARCODE Fish DNA Barcoding Kit Start to Finish
DNA Barcoding Kit Workflow PCR amplification Fish sample Extract genomic DNA Sequencing, Sequence Analysis Gel electrophoresis
DNA Extraction Overview Incubate 10 min at 55oC + Resuspension + Lysis Buffer Buffer Bind DNA to column (Matrix Solution) + Neutralization Buffer Wash column with Wash buffer Elute DNA
Quick Guide – Fish Prep Label tubes “1” for fish sample 1, “2” for fish sample 2. Also label with your initials. 1 2 1 Cut a piece of fish approximately the size of a pencil eraser-head, from your first fish sample. Slice it until finely minced. Transfer the sample into microcentrifuge tube 1. 2 1
Quick Guide – Fish Prep Using a new cutting implement, cut a piece of fish approximately the size of a pencil eraser-head, from your second fish sample. Slice it until finely minced. Transfer the sample into microcentrifuge tube 2. 3 2 Add 200 ml of Resuspension to your two tubes and flick several times to ensure full submersion of the fish in the resuspension solution. 4
Quick Guide – DNA Extraction Add 250 µl of Lysis to each tube and mix gently by inverting tubes 10 times to mix contents. 5 Incubate samples at 55oC for 10 min. The samples do not need to be shaken during incubation. 6
What is happening during DNA extraction?Where is the DNA at each step? mito DNA • Resuspension • buffered solution with chelating • agents to destabilize cell membranes • DNA: pellet (fish) or supernatant? • Lysis • alkaline solution that disrupts • membranes, releases DNA, • denatures DNA • DNA: pellet (fish) or supernatant? • Heating • helps to break down tissue to • recover more DNA • Neutralization • solution that counteracts the effects of • alkalinity, renatures smaller pieces of DNA, • helps precipitate DNA and remove detergents • DNA: pellet (fish) or supernatant? nuclear DNA
What is happening during DNA extraction?Where is the DNA at each step? • Matrix • silica based suspension that binds • DNA but not RNA or proteins • DNA: column or flow through? • Wash • removes other small particles in the • prep that are nonspecifically bound • to the Matrix • DNA: column or flow through? • Elute • low ionic strength buffer or water • releases DNA from the silica • DNA: column or flow through? mito DNA pelleted proteins, membranes, etc
Quick Guide – DNA Extraction Add 250 ml ofNeutralization to each tube and mix gently by inverting tubes 10 times to mix. A visible cloudy precipitate may form. 7 Centrifuge the tubes for 5 min at top speed (14,000 x g) in the microcentrifuge. A compact pellet will form along the side of the tube. The supernatant contains the DNA. 8
1 2 Quick Guide – DNA Extraction Snap (do not twist!)the bottomsoff of the spin columns and insert each column into a capless 2 ml microcentrifuge tube. Label columns 1 and 2 + your initials. 1 2 9 Transfer the entire supernatant (500–550 µl) of each fish sample into the appropriately labeled spin column. Try not to get any of the particulates into the spin column because they will clog the column and prevent you from continuing. 10
1 2 2 1 Quick Guide – DNA Extraction Thoroughly mix the tube labeled Matrix to make sure particulates are completely resuspended before use. Add 200 ml of thoroughly resuspendedMatrix to the first column and pipet up and down to mix. Using a new pipet tip, add 200 ml of thoroughly resuspended Matrix to the second column and pipet up and down to mix. 11 12 Centrifuge the columns for 30 sec at full speed. Remove flow through to waste. 13
2 1 Wash Quick Guide – DNA Extraction Add 500 µl ofWash and wash the samples by centrifugation for 30 sec. Remove flow through to waste. 14 Repeat wash step and centrifugation as shown above. 15
Quick Guide – DNA Extraction 1 2 Centrifuge columns for a full 2 min to remove residual traces of Wash and dry out the samples 16 Remove the spin columns and discard the 2 ml microcentrifuge wash tubes. Place the spin column for each sample into a new capless 2 ml tube. 1 17 new capless tube
2 1 Quick Guide – DNA Extraction Using a fresh pipet tip for each sample, add 100 µl of distilled water to each spin column, being careful not to touch the resin. Elute the DNA by centrifuging for 1 min. 18 1 2 Label two clean 2 ml microcentrifuge tubes (with caps) Fish 1 and Fish 2 and your initials. Transfer the eluted DNA into the appropriately labeled tube. 19
PCR amplification of COI gene • Fish DNA has been extracted • Next step is to amplify a portion of the mitochondrial COI gene • Generate enough DNA to visualize on a gel • Generate enough DNA to send for sequencing • Assemble reactions of • Template DNA • Primers • Nucleotides • Taq polymerase • Magnesium chloride • Multiple rounds of thermal cycling to amplify DNA Mitochondrial DNA
PCR – Degenerate primers • When trying to amplify DNA from a wide variety of samples (many different fish) using the same primer set, creating degenerate primers is a useful approach • Determine a consensus sequence derived from several species • Pike: A-C-T-G-G-C-T-T-A-G-C • Carp: A-C-T-G-G-A-T-T-A-G-C • Tuna: A-C-T-G-G-G-T-T-A-A-C • Bass: A-C-T-G-G-T-T-T-A-G-C • Hake: A-C-T-G-G-A-T-T-T-A-C • CONS.: A-C-T-G-G-N-T-T-A-R-C • The consensus/degenerate primers bind to DNA from all of these fish, whereas regular primers would only bind to one • The primers used in our Fish DNA barcoding kit contain degenerate positions to amplify DNA from as many different fish as possible!
PCR – Overview Heat (94oC) to denature DNA strands Cool (55oC) to anneal primers to template Warm (72oC) to activate Taq polymerase, which extends primers and replicates DNA Repeat 35 cycles Your PCR products will be given to you now for electrophoresis
Quick Guide - Electrophoresis Add 2 µl of UView 6x loading dye to each sample, using a new pipet tip each time.Mix samples well. Load the agarose gel in the following lane order and volumes, using a new pipet tip each time: Lane Sample 1 EMPTY 2 EMPTY 3 20 µl MWR 4 12 µl (+) E 5 12 µl (–) E 6 12 µl 1 E 7 12 µl 2 E 8 EMPTY 200 V 20 min 0.25x TAE
Visualizing DNA after electrophoresis UViewTM Ethidium Bromide Fast BlastTM Nontoxic Toxic, Mutagen Nontoxic Loading dye + Stain Stain Stain Instant Instant Requires wait time View with UV View with UV View by eye Very sensitive Most sensitive Less sensitive
Use UV transilluminator to visualize UView or Ethidium Bromide 1. MW ruler 2. (+) control 3. (-) control 4. Fish 1 5. Fish 2 UViewTM Ethidium bromide 1 2 3 4 5
Bioinformatics – Alignment Run . . . . . What is the longest run of tails I should expect for 100 tosses? R = log1/p (n) Paul Erdos‐Alfréd Rényi law R = longest run p = probability (for “fair” coins its 0.5) n = number of tosses Paul Erdos
Bioinformatics – Alignment Run . . . . . What is the longest run of tails I should expect for 100 tosses? R = log1/0.5(100) = 6.64 ….so if I get more than 6.64 tails in a row when tossing 100 times, I might wonder if something besides randomness is going on Paul Erdos
Bioinformatics – Alignment AATCGTACTG AACCATTCAG If I call alignments tails. What is the longest run of tails I should expect for comparing two 10 bp sequences? R = log1/0.25(100) = 3.32 Sequence lengths multiplied ¼ chance for getting same base
Bioinformatics – Alignment DNA is not a 4 sided Coin - Account for probability of bases being switched out for each other by a scoring matrix Match Transversion Transition Change of base type – Purine for Pyrimidine Same base type – Purine for Purine
G A A T T C A G T T A G 1 1 1 1 1 1 1 1 1 1 1 G 1 1 1 1 1 1 1 2 2 2 2 A 1 2 2 2 2 2 2 2 2 2 2 T 1 2 2 3 3 3 3 3 3 3 3 C 1 2 2 3 3 4 4 4 4 4 4 G 1 2 2 3 3 4 4 5 5 5 5 A 1 2 3 3 3 4 5 5 5 5 6 Bioinformatics – Alignment DNA is not a 4 sided Coin
G A A T T C A G T T A G 1 1 1 1 1 1 1 1 1 1 1 G 1 1 1 1 1 1 1 2 2 2 2 A 1 2 2 2 2 2 2 2 2 2 2 T 1 2 2 3 3 3 3 3 3 3 3 C 1 2 2 3 3 4 4 4 4 4 4 G 1 2 2 3 3 4 4 5 5 5 A 1 2 3 3 3 4 5 5 5 5 6 Bioinformatics – Alignment DNA is not a 4 sided Coin
Bioinformatics – BLAST tool Query Database ATTCGCAT ATT TTC TCG CGC GCA CAT 1) Break into words 2) Find Matches and let go of all the other database words that don’t match 3) Extend from match 1 base at a time until score falls off 4) Use two anchors to define and alignment, compare, score E-value
Bioinformatics – BLAST tool E-value Theoretically, we could trust any result with an E-value ≤ 1 In practice – BLAST uses estimations. • E-values of 10-4 and lower indicate a significant homology. • E-values between 10-4 and 10-2 should be checked (similar domains, maybe non-homologous). • E-values between 10-2 and 1 do not indicate a good homology
Bioinformatics – Linking DNA Barcoding and Protein Profiler + Compare light chain of myosin sizes Compare E-value for CO1 gene = Stronger Evidence for Evolutionary Relationship
Bioinformatics using BOLD-SDP BOLD-SDP = Barcode Of Life Data systems – Student Data Portal Quick Start tutorial available online