Download
1 / 36
360 likes | 512 Views
Use of LTHIA to Reduce Nonpoint Source Water Pollution. Larry Theller Bernard A. Engel Agricultural and Biological Engineering Department Purdue University In conjunction with POLIS Center, IUPUI and Indiana Dept. Environmental Management.

E N D
Use of LTHIA to Reduce Nonpoint Source Water Pollution Larry Theller Bernard A. Engel Agricultural and Biological Engineering Department Purdue University In conjunction with POLIS Center, IUPUI and Indiana Dept. Environmental Management
http://danpatch.ecn.purdue.edu/~watergen/owls/htmls/reg5.htm Processes for Hydrologic Impact Analysis Using Web-GIS Tools Outlet Point Selection Using Aerials, roads, or streams Run Watershed Delineation To get contributing area Watershed Delineation Result Examine maps Reflect Land Use Change Using Online Digitizing Run L-THIA Runoff and NPS Output/Impact Evaluation
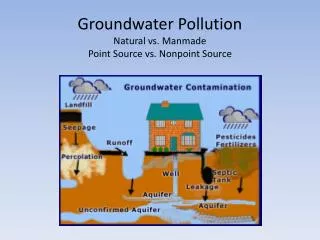
Long Term Hydrologic Impact Assessment (LTHIA) • Calculates the chemistry and volume of runoff water, based only on landuse and soil type. • Changing the landuse in an area will change the typical runoff chemistry. • This uses process called “curve-number.” • In use for 5 years.
We break soils into 4 hydrologic conditions, which are used to estimate runoff volume. We break landuse into 8 basic types, which are used to estimate chemistry.
Databases provide input • Weather data (30 years of real rainfall) • Soil data (SSURGO or STATSGO ) • Elevation data (for contributing area) • Water features: NHD High-resolution • Landuse: NLCD 2001 or 2007 county
Landuse NLCD 2001 Landuse is installed for the tan watersheds. The green watersheds use 1992 NLCD at this time. We anticipate installing the remainder of the NLCD 2001 in the next 10 days. SSURGO soils will be installed shortly after that.
Curve Number Basics: rainfall to runoff ratio for different surfaces Direct Runoff Rainfall http://www.ecn.purdue.edu/runoff/documentation/scs.htm
Averaged mass of NPS contaminant from each landuse EMC Table
Take-Home points DEM is only used to calculate flowshed DEM is not used for erosion – or runoff Runoff is based on surface type – not slope won’t account for frozen ground 30 year average rainfall Chemistry is based on landuse averages
IWQA GIS Interactivehttp://www.in.gov/idem/5219.htm Button to Delineate Watershed Select Outlet Point Coordinate is passed to LTHIA
LTHIA isolates the flowshed to estimate the runoff, so it calculates runoff for the -shed.
GoogleMaps entry to WD/LTHIA Google Maps interface allows three types of delineation – a) click a point on the map, b) Enter X and Y or Longitude – Latitude c) Click to select a HUC12 watershed (coming soon for Illinois). http://cobweb.ecn.purdue.edu/~watergen/
The HUC12 delineation returns a landuse breakdown for the entire watershed and allows LTHIA to be run on the entire 12 digit watershed.
Watershed outline can be displayed over Google Maps™ or downloaded as KML to use in Google Earth™
User may decide to change landuse and propose a development scenario to the LTHIA model. The Delineated Watershed displayed over layers
User can view delineated results on IWQA or proceed to edit landuse and run LTHIA on watershed
Change Land Use in the Watershed Using Online Digitizing Tool For Example,Add Low Density Residential, Commercial, and High Density Residential Areas Scroll down to save scenario
Scenario Results Page Present Land Use Data After Change Land Use Data Application Buttons forHydrological Model Operation
L-THIA Input Page After Changing Land Use Multiple scenarios – offer multiple development options. User constructs scenario by online digitizing.
L-THIA Result Runoff Tables Look for the NPS tab Can display pre-and post calibration and also land-use change scenarios. Tables can be copy – paste into Excel™
Comparison Chart for Runoff and Land Use to Evaluate the Land Use Change Impact on Hydrology
Series of 5 study watersheds run in LTHIA with development scenarios (addition of commercial , residential, and industrial developments.
Compiled results for the study watersheds with NPS effects predicted for development scenarios (addition of commercial , residential, and industrial developments onto various soils.
Print and Download Page Watershed, curve number, landuse, etc may be downloaded.
https://engineering.purdue.edu/~lthia/ Gmaps test: http://cobweb.ecn.purdue.edu/~watergen/wcams_10/lthia2.html Alternate Entry Point More information ( PDF Flyers) http://cobweb.ecn.purdue.edu/~caagis/LTHIA/LTHIA_fact_sheet.pdf