Download
1 / 33
330 likes | 478 Views
Designing Practice Based Approaches for Managing Agricultural Nonpoint-Source Water Pollution. Catherine Kling Center for Agricultural and Rural Development, Dept. of Economics, Iowa State University . Upper Midwest Stream Restoration Symposium February 24-27, 2013 La Crosse, Wisconsin.

E N D
Designing Practice Based Approaches for Managing Agricultural Nonpoint-Source Water Pollution Catherine Kling Center for Agricultural and Rural Development, Dept. of Economics, Iowa State University Upper Midwest Stream Restoration Symposium February 24-27, 2013 La Crosse, Wisconsin This research was supported by the National Science Foundation, Dynamics of Coupled Natural and Human Systems Program, award number DEB-1010258, as well as two regional collaborative projects supported by the USDA-NIFA, award numbers 2011-68002-30190 and 2011-68005-30411.
U.S. Water Quality: Lakes • Lakes, Reservoirs, Ponds: • 42% assessed, 65% inadequate water quality to support uses • Over 11 million acres are “impaired” • Agriculture third highest source of impairment The diverse aquatic vegetation found in the Littoral Zone of freshwater lakes and ponds. A cyanobacteria bloom in a Midwestern lake.
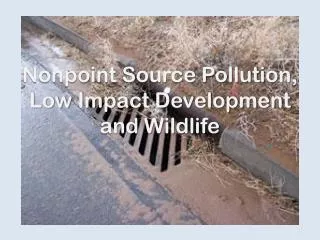
Water Quality: Rivers & Streams • Rivers and Streams: • 26% assessed, 50% inadequate water quality to support designated uses • Nearly ½ million stream miles are “impaired” • Agriculture leading source of impairment (identified as cause of 22% unknown second highest) Photos courtesy Iowa DNR
Time trend Figure 1. US waters assessed as impaired Source: EPA National Summary of Assessed Waters Report
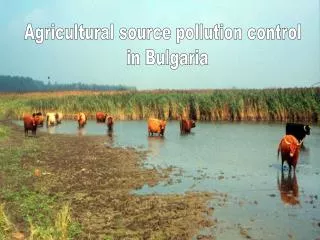
What abatement options exist? Examples from U.S. Agriculture • In field Management Practices • Reduced (no) tillage • Manure, fertilizer management/reduction • Cover crops, rotation changes • Land retirement • Structural Practices • Buffers • Grassed Waterways • Denitrification, controlled drainage • Wetland restoration
Conservation practices • Photos courtesy of USDA NRCS
Land Retirement Panoramic view of gamma grass-big blue stem planting http://www.fsa.usda.gov/Internet/FSA_Image/ia_767_15.jpg
Wetlands Restoration Photo courtesy Missouri NRCS
Efficacy and Cost of Practices • Vary by • Pollutant • Field characteristics • Land use in watershed • Provision of other ecosystem services • Ideally, all of these factors considered in efficient policy design
In sum, have to deal with all of these aspects • Enormous number of farm fields/decision makers • Each : one or more land use/conservation practices Retire land (e.g., CRP), Reduce tillage, Terraces, Contouring, Grassed Waterways, Reduce fertilizer, better timing, etc. • Costs and effectiveness vary across locations • HOW? Use models to guide policy
Soil and Water Assessment Tool • Watershed-scale simulation model developed by USDA - Agricultural Research Service • Predicts ambient (instream) water quality associated with a spatially explicit set of land use/conservation practices • Gassman et al. (2007) identify over 250 publications using SWAT
Watershed d b c a a a d a b a a b a SWAT: N, P, and Sediment • 13 Fields, 4 land use/abatement options: a, b, c, d • SWAT simulates water quality under alternative land use, abatement activities
Least Cost Problem • What is the optimal placement of conservation practices? • Brute force strategy: • Using water quality/hydrology model, analyze all the feasible scenarios, picking cost-efficient solutions • But, if there are N abatement possibilities for each field and there are F fields, this implies a total of possible NF configurations to compare • 30 fields, 2 options over 1 billion possible scenarios!
Strength Pareto Evolutionary Algorithm Search technique to approximate pareto optimal frontier • Integrate Evolutionary Algorithm with water quality model • Search for a frontier of cost-efficient nutrient pollution reductions • Zitzler, Laumanns, and Thiele. “SPEA2: Improving the Strength Pareto Evolutionary Algorithm,” TIK-Report 103, May 2001, Errata added September, 2001
Terminology b d c c a a a a d b a d “Individual” = specific assignment of practices to fields “Population” = set of individual watershed configurations
SPEA2 Applied to Optimal Watershed Design Step I: Generate initial population Step II: Run Swat and compute costs Step III: Identify best individuals Step IV: Evaluate stopping rule Pareto frontier Step V: Choose parents Step VI: Create offspring
Pareto Frontier • Strength S(i)= # of individuals i dominates • Raw fitness R(i)= sum of strengths of individuals that dominate i • Low value best: R(i)=0 means i is on the frontier
Boone River Watershed Iowa • ~586,000 acres • tile drained, 90% corn and soybeans • 128 CAFOs (~480,000 head swine)
Natural Environment: Boone • Some of the highest N loads in Iowa • TNC priority area biodiversity • Iowa DNR ProtectedWater Area
Common Land Unit Boundaries • 16,430 distinct CLUs • Detailed data related to: land use, farming practices, production costs, slope, soils, CSRs, etc. • Weather station data
The Land use/Abatement Set • For each CLU • Current practice • Land retirement • No tillage • Reduced fertilizer (20%) • Cover crops • Sensible combinations
Per acre average costs of abatement actions needed to achieve equal percent reductions in N and P
Policies to Attain Nutrient Reductions • Taxes (or subsidies) • Voluntary Approaches (may be with financial incentives) • Regulations • Technology requirements • Standards (permits) • Permit trading, “cap-and-trade,” “offsets” • Other (compliance requirements, labeling requirements)
Regulation types • Technology Requirements: required to adopt specific method of production or technology catalytic converters, • Standards: required to have a permit to cover their emissions or meet a standard zoning requirements • Firms may be allowed to buy and sell permits from one another • Compliance Requirements
Property rights with polluters • Cost share programs - voluntary • Conservation Reserve Program, • Environmental Quality Improvement Program, • Conservation Security Program, and • Wetlands Reserve Program , etc. • Reverse auctions • Offsets (baseline and trade) • Labeling, consumer information programs • Conservation compliance
Property rights with society • Approach for many pollutants • Industrial sources air pollution • Point sources water pollution • Smoking bans, etc. • Policies that are consistent with: • Cap and trade (capped sectors) • Regulatory requirements
BMPs: Everglades Agricultural Area • 718,000 acres (40 acre fields) • Everglades Regulatory Program • goal 25% P reduction overall • mandatory BMPs, 1995 • Implemented via points • flexibility in BMPs, 25 points/farm • expert judgment set point values • must implement and monitor WQ Wikipedia
EAA Regulatory Program • Property Rights: with citizens • First 3 years: 55% P load reduction (SFWMD, 1998) • Unable to find information on costs • Direct cost of BMPs • Lost profit • Cost of monitoring • Cost of program implementation