Download
1 / 36
370 likes | 380 Views
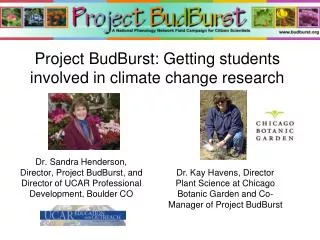
Project BudBurst. Dr. Jennifer Schwarz, Director Center for Teaching & Learning, Chicago Botanic Garden and BudBurst Lead Science Educator. Getting citizens involved in climate change research. Climate Change. CO2 and other greenhouse gases are at their highest level in 400,000 years

E N D
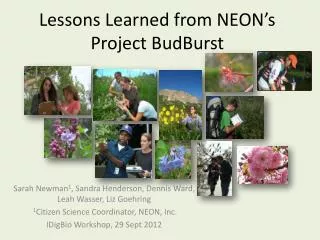
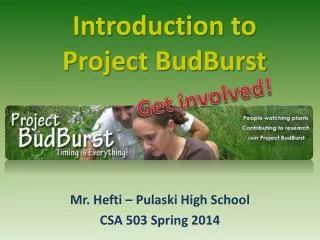
Project BudBurst Dr. Jennifer Schwarz, Director Center for Teaching & Learning, Chicago Botanic Garden and BudBurst Lead Science Educator Getting citizens involved in climate change research
Climate Change • CO2 and other greenhouse gases are at their highest level in 400,000 years • The planet is warming faster than any time in last 10,000 yrs. • Many plants will not be able to shift ranges to keep pace with warming
During the 20th century, the Earth’s average temperature rose 0.6°C. • Some effects: • Arctic warming twice as fast • Melting snow and ice • Changing extreme weather events (droughts, heat waves, hurricanes) • Sea level rise • Longer growing season • Changes in timing of phenological events During the 21st century, models predict Earth’s average temperature will rise between 1.8 and 4.0° C. IPCC (2007)
Climate change is already here • About half of the US has warmed one hardiness zone based on the last 15 years of weather data
Natural migration will be difficult • In the past, plants and animals migrated as the climate changed • Today anthropogenic, as well as natural, barriers limit dispersal ability Barriers to migration (from Abraham J. Miller-Rushing and Richard B. Primack, Plant Talk 2004)
Responses to Climate Change “It is not the strongest of the species that survive, nor the most intelligent, but the ones most responsive to change!” Charles Darwin • Coping: ability of individual organisms to respond • Adaptation: ability of species to respond over time. • Extinction: inability of organisms to respond to changing environments in time • Mitigation • Attempt to reduce the magnitude of climate change through research and through our actions • Conserve habitats, conduct ex situ work, assist migration
Understanding Nature’s Calendar Phenology is the science that measures the timing of life cycle events in all organisms phōnḗ -ol-ō-gy Not to be confused with Phrenology, the study of bumps on heads! Or Phonology, the study of how sounds are organized and used in language.
Coping: Phenological changes 5/30/1868 • Phenology = the timing of natural events • Many plant species respond via plasticity (individual flexibility) to warming temperatures by flowering earlier; earlier flowering dates can also evolve • Phenological shifts can be detected using herbarium specimens, photos, naturalists’ diaries…much of this work in the US has been done by Richard Primack at Boston Univ. 5/30/2005
Brief History of Phenology The Japanese have been recording the timing of Cherry Blossoms since 900AD Grape harvest dates in Switzerland have been recorded by wine makers since 1480 AD Thomas Jefferson referred to the progression of blooms in his garden as “acts in a play” Henry David Thoreau and Aldo Leopold kept extensive phenological records that are being used today There are also numerous ‘shoebox’ naturalists whose data may prove extremely valuable
Phenology monitoring • Satellites • short history, cloud cover interference need for ground truthing. • In-situ Species observations • Cloned plant observations • time & resource intensive • Web cams
Phenological changes in Chicago • Contemporary phenology records from Project BudBurst were compared to phenology records gathered from 1950-1994 published in “Plants of the Chicago Region” by Swink and Wilhelm • Half of the species have had an early flowering record in the last 3 years, from a few days to one month earlier than previously recorded • Gerry Wilhelm reports that roughly half of the plant species he saw in the 60s and 70s (while working on earlier editions of the book) have now disappeared from the Chicago region flora
Ecological mismatches Phenological changes are particularly troubling when mutualistic relationships are disrupted, such as when a plant is cued by temperature and an animal by day-length. The pied flycatcher example: Temperature Cued • The English oak blooms two weeks earlier • The moth larvae hatch two weeks earlier to feed on the leaves. Day-length Cued • The pied flycatcher continues to migrate at the same time • The larvae population is dwindling by the time the birds arrive • The bird population is declining as a result.
Citizen science • Is a venue to engage the public in meaningful research • Improves scientific literacy via participation in the scientific process (youth and adult audiences) • Provides richer, finer-grained data sets for professional scientists and students to analyze Your data can help!
Educational Goals of Project BudBurst • Increase awareness of phenology as an area of scientific study • Increase awareness of the impacts of changing climates on plants and the environment, and • Increase science understanding and appreciation by engaging participants in the scientific process.
BudBurst is for Everyone • No special equipment or instruments needed to participate • Provides an easily accessible way to make the abstract concept of climate change visible and concrete • Provides individuals and families with the opportunity to contribute to a better understanding of climate change • Introduces children to nature and the environment • Requires careful, focused, observation that helps develop scientific skills
Almost 5000 registered locations Over 10,000 observations 50 states Participant locations across the country
How to Participate As a visitor enter an observation without sharing personal information As a registered member create a “My BudBurst Space” site and observe multiple plants & locations over time. • Register • Create a MyBudBurst Space • Create a site/classroom • Choose a site that you visit often • Identify the plants at your site • Add plants to your site • See if the plants on your site are on the BudBurst list • If not, find your plants common and scientific names • Observe • Identify phenophases of interest • Visit your site regularly • Enter data
Starting out To Register • Name • Address • Comments • Email address • Teacher registration • Set login & Password X
Use an address or location name to find GPS coordinates Create a Site • Find a site(s) near your school • Choose a name that you will remember • Enter site details • Enter site description • Click Submit • You Can • Create multiple classroom at the same time • Have more than one classroom using the same site and same plants • Have one class observe multiple sites • Have different classes observe the same site over multiple years
Identify Plants • Find your plants by state, plant group, or common name • Use the BudBurst Identification Guides • Common & Scientific Names • Detailed Description • Habitat • Geographic Range • Phenological Observations of interest • Fun Facts
Identify Phenophases Project BudBurst is not just for springtime. • 14 phenophases of interest • Flower (first, full, end) • Leaf (first, full, color change, withered, drop) • Pollen (first, full, end) • Fruit (first ripe, full ripe, die-off) Photo courtesy Mark Schwartz
Phenophase Guides • Relevant phenophases • Phenophase photographs • Order of phenophase • Detailed descriptions
Create a Site Part II: Add Plants • Choose a site to add a plant (you may have more than one) • Choose from the BudBurst dropdown list or add your own • Click Submit to add the plant • Enter data, add another plant, or return to your BudBurst space
Enter Data • Use the phenophase guides to identify the phenophases of interest for your plants • Start watching your plants before the expected event • Enter each data point into BudBurst
MyBudBurst Site 2Class 3 MyBudBurst Site 1AClass 2 MyBudBurst Site 1 Class 1 Student Reporter Student Reporter Student Reporter Student Reporter Student Reporter Student Reporter … … … Student Reporter Student Reporter Student Reporter Teacher and Student Registration Teacher Registration w/professional email • Teacher Account – MyBudBurst space • Create a site or sites for each classroom • Request student passwords for each site • Add/Delete/Access to all sites and plants • Add/Delete/Access to student passwords
Classroom Management • Create up to 40 student accounts for each site (make sure to print or save the passwords!) • View student accounts • Delete student accounts
Last 100 Downloads-satellite view 2010 First Flower Mapping & Data Analysis Current Mapping Features • 100 most recent observations • Observations by phenophase • Observations by species • Color Coded data points • Clickable data points • Zoom in/out • Terrain Choice • Downloadable data sets Phenophases of Forsythia
Historical Data • Cook County, IL Forest Preserve District phenological data 1935-present • Chicago Botanic Garden historical data sets (Dixon Prairie & What’s in bloom) • Videos of forest preserve workers talking about their experiences • Future national call for historical data sets from forest preserve districts, botanic gardens, regional and national parks, etc. • Mapping and analysis tools will include historical data set comparison by species and phenophase over time Courtesy of the Cook County Forest Preserve District
Coming Soon: Mobile phone technology Features Mobile phones used to capture and upload data in the field Data automatically geotagged Photo uploads will help with quality control of data being reported Real time feedback Web 2.0 social networking Conceptual image for illustrative purposes only UCLA Center for Embedded Network Sensing is developing software for mobile-to-web portal system using Project BudBurst database.
Project BudBurst exists due to the support from funders, partners, and collaborators • In Collaboration and Partnership • National Phenology Network • National Ecological Observatory Network • Windows to the Universe • UC LA – Center for Embedded Network Sensors • Oak Ridge National Laboratory • Windows to the Universe • Managed by • University Corporation for Atmospheric Research • Chicago Botanic Garden • With Funding from • US BLM • NEON • USGS • USDA Forest Service • US Fish and Wildlife • National Geographic Society • NASA • NSF
Participating in Project BudBurst can provide an engaging outdoor experience and provide data that is useful to scientists studying climate change impacts on plants. Contact information: Jennifer Schwarz Kay Havens jschwarz@chicagobotanic.orgkhavens@chicagobotanic.org www.budburst.org
How can Project BudBurst Data be used to better understand climate change? • Comparison with existing and historical phenological data sets • Comparisons with existing climate data • “My BudBurst” allows personal archived data over time • Our data is available to individuals, families, educators, students, and scientists.