Download

1 / 26
260 likes | 543 Views
Subscriber Data Integrity. Customer Management from a Solid Foundation: Telecom Business Intelligence Starts Here Simon Marwood President – Scorecard Systems Inc. Toronto, Canada / London, UK / Galway, Ireland / Sao Paulo, Brazil smarwood@scorecardsystems.com

E N D
Subscriber Data Integrity Customer Management from a Solid Foundation: Telecom Business Intelligence Starts Here Simon MarwoodPresident – Scorecard Systems Inc. Toronto, Canada / London, UK / Galway, Ireland / Sao Paulo, Brazil smarwood@scorecardsystems.com +1 416 580 2416 / +44 791 346 8120
Subscriber Data Integrity: BI starts here • Why Subscriber/Product/Unit Analysis is the core to Customer Management in your BI solution • What are the traditional subscriber tracking metrics, and how should they be expanded? • What are the pitfalls with traditional subscriber tracking methodologies? • What is the successful approach many telecom operators have used to drive higher data quality and richness through change data capture / business rule methodologies within an EDW / Data Mart environment
Subscriber Analysis The Core to Customer Management in a BI Solution: You have to get this right first.
Subscriber Analysis: The Foundation • Business Intelligence For Telecoms Operators: • “Effectively Transforming Telecoms Data Into Strategic Intelligence To Radically Improve Decision Making, Enhance Operational Efficiencies And Create Competitive Advantage”. • “The challenge as they move forward is to deliver increasingly more customer-focused revenue generating services, while reducing OpEx”. • What does this mean to many attendees of Telecom Data Warehousing / Business Intelligence conferences? • CDR / xDR Analysis • Monitor calling patterns to optimize network • Predict churn based on dropped call records, decreases in outbound calls • Predict churn based on churn from friends + family that were formerly with the carrier or its landline/wireless affiliate • Cost of Acquisition / Customer Profitability Analysis • Retain profitable customers • Reduce cost of acquisition in low margin channels • Active Data Warehousing • Feedback loop to CSRs to save customers • Identification of upsell opportunities • Revenue Assurance • Traffic, traffic, traffic
Subscriber Analysis: The Foundation • BUT: • Most carriers do not accurately capture activations, churn, plan to plan migrations, transfers between landline/wireless phones • Most carriers do not accurately capture “customer-focused revenue generating services” and the related activity in their subscriber base. • Most executives STILL do not have one version of the truth. • In many cases the result: • Use of DW/BI tools is restricted to a core group of analysts or power users. • Wide deployment to sales / marketing / finance is restricted due to a lack of trust in the numbers. • “Mission critical spreadsheets” continue to proliferate. • Different business rules. • Different data sources. • Long turn-around time on change requests to IT due to hard-coded rules in DW or BI tools. • The good news is that the opportunity is there to deploy to a much broader and deeper audience by solving this issue.
Subscriber Analysis: The Foundation • In order to best empower: • Traffic Analysis • Cost of Acquisition / Profitability • Active Data Warehousing • Revenue Assurance • You need to know: • Was this really churn? • Was this really a new acquisition? • Was the new customer-focused revenue generating service: • Initiated at the same time the customer activated? • A first time upsell to the product? • A reconnect of a product the customer had previously cancelled? • Rate plan surfing? • Bad news, because it is connected to a downgrade from a bundle or package?
Subscriber Metrics: Fixed Line - Traditional • Beginning Active Units • Connects (Ins) • Disconnects (Outs) • Voluntary Disconnects (Outs) • Involuntary Disconnects (Outs) • Migrations (maybe – often a plug if the numbers don’t tie) • Usually hard-coded SQL: If product A cancels and product B activates, then count migration from A->B • Net Connects • Ending Active Units • % Churn • % Penetration
Subscriber Metrics: Mobile - Traditional • Beginning Subscribers • Activations • Deactivations • Voluntary Deactivations • Involuntary Deactivations • 30 Day Deactivations / Negative Gross Activations • Usually based on Deactivation Reason Code • Reactivations (maybe – often based on a reason code) • Migrations (maybe – often a plug if the numbers don’t tie) • Net Activations • Ending Subscribers • % Churn • Attempts are made to exclude telephone # changes, account swaps, phantom churn, often based on reason codes and assumptions
Subscriber Metrics: MSO/DTTH - Traditional • Beginning Units • Connects • New Connects (based on work order type) • Reconnects (based on work order type) • Restarts (based on work order type) • Moves (based on work order type) • Upgrades • Billing System 1: If the bill today is one penny more than yesterday, EVERYTHING is an upgrade • Billing System 2: if it is a new service code on an existing client, it is an upgrade • If customer connects Movie Channel 1 and disconnects Super Movie Bundle, Movie Channel 1 is counted as an upgrade, even though customer profile is now much worse! • Disconnects • Voluntary Disconnects (based on work order type) • Involuntary Disconnects (based on work order type) • Moves (based on work order type) • Downgrades • Ending Units / RGUs / Customer Relationships • % Churn / % Penetration
Net Pending Connects New Pending Connects Pending Connects -> Active Slippage Pre-Field Cancel Field Cancel Net Pending Disconnects New Pending Disconnects Pending Disconnects -> Active Pending Disconnects -> Disconnects Homes Passed Active Homes Passed Formerly Active Homes Passed Never Active Homes Passed Customer Relationships / RGUs % Churn / % Penetration Subscriber Metrics - Expanded • Activations / Connects • Gross Activations (+) • New Activations (+) • Port Activations (+) • Negative Gross Activations (-) • De-Re Activations (-) • Adds (+) • Reactivations • Reconnects (Voluntary/Involuntary) (+) • Restarts (Voluntary/Involuntary) (+) • Re-adds (Voluntary/Involuntary) (+) • Port Reactivations (+) • Deactivations • Full Deactivations (+) • Port Deactivations (+) • De-Re Deactivations (-) • Drops (+) • Suspends • Seasonal / Voluntary Suspends • Involuntary Suspends • Migrations • Upgrades/Downgrades/Sidegrades • U/D/S To • U/D/S From
Traditional Subscriber Reporting Methodologies(and why they are bad)
Basics: Where To Put Your Business Rules • Many (not all) BI Tool Salespeople: • Just apply some rules in the data load into our BI tool! • Works very well if you are selling cheese or suits. • Telecom world – not so straightforward • Trust Issue: • System Shows 135 DSL Connections. • Sales Person Has 150 DSL Connection Forms. • Does Not Know that 10 are still Pending Connections, 5 were caught as De-Re. • If Business Rules applied in OLAP / Q&R tool, now need to re-write same rules in detail queries – replicating business rules in many different places. • Complexity Issue: • Telecom Carriers are no longer the water company.
Method 1: Count Billed Customers • If we sent a bill, they must be a customer, or the service must be active: • If customer/product activated on the 31st of the month and was not billed: not counted • If customer/product was billed on the 10th of the month and cancelled on the 12th: is counted • Prepaid environment: no bills WRONG! WRONG! WRONG!
Method 2: Snapshots • Extract snapshot table from Billing System / Data Warehouse • Drive Customer/Product Activity from dates. Customer IDActivation DateDeactivation DateProduct Code 2503812 January 1, 2007 March 1st, 2007 February 28th, 2007 114 111 January 3, 2007 • January 1st: Activation on Product 111 • January 3rd: • Customer Changes to Product 114 • Now appears the Customer Activated on 114 • Marketing would want to show this as a migration from 111 to 114 • February 28th: Deactivation on Product 114 • March 1st: Reactivation on Product 114 • In the Billing System, Deactivation Date turns blank • Reporting System “trusts” the snapshot • Activation on March 1st • In many cases – history vanishes – January and February numbers change
Method 3: Add Up The Service Orders • This method is used by the majority of telecom carriers • Add up: New Connect, In, To, Activate, Change Orders • Count As New Connects • Add up: Disconnect, Out, From, Cancel, Change Orders • Count As Disconnects • Net Connects = New Connects – Disconnects • Ending Units/Subscribers = Beginning Units/Subscribers + Net Connects • Overstates Churn AND Activations • Move from 10 Main Street to 55 Queen Street • Handset Migration not done properly by CSR • Bulk Updates to Billing System = No Service Orders! • “TRUST THE BILLING SYSTEM” • After all, the Billing System is an outstanding BI Tool, which is why we’re all here
Method 3a: Service Orders + Manual Entry • Many carriers realized that trusting the billing system was not a good idea: • Needed more accuracy • Needed more richness • What else was available? • Manually entered disconnect/connect reason codes • Manually entered work order types • After all: • CSRs are all extremely well trained. • Dealers/Sales People never try to cheat and code transactions as sales to earn extra commissions • CSRs/Dealers are outstanding BI Tools, which is why we’re all here • Disconnects within 30 days based on Reason Code: Buyer’s Remorse / Activation In Error • 50% of the time, these codes were being used 1-10 years later. CSRs were cheating the system. • Commission paid to Residential Reps who upsell to a Voice Mail package • Two codes in the billing system for Voice Mail package. • Every 61 days, reps would flip-flop the package • Overpaid commissions by 15%
Subscriber Activity: What We Have Seen • Majority of carriers: • Sales reports 35,000 new activations • Marketing reports 34,900 new activations • Finance reports 29,000 new activations, accuses Sales and Marketing of cheating for extra commissions • Some carriers: • Top-line numbers are the same (“One Version Of The Truth”), but: • Upon drilling down to tariff, rate plan, sales person, geography, customer segment, tenure, numbers again do not tie out; or • Business rules use method 1-3, and are therefore not as accurate/rich as they should be. • And a few carriers: • Use more accurate methods for business rules, but: • Business rules, product matching algorithms for upgrades/downgrades are hard-coded • Audit/Balancing trail to billing system hard to follow
Subscriber Activity: Getting It Right(as Telecom BI starts here)
Subscriber Activity: Getting It Right • Get rid of all business rules that are not stored relationally. • You need to be able to drill back to the customer detail. • You need to be able to provide an audit trail back to the source systems. • You need to be able to use all of the BI tools that your company has suggested with the business rules stored in one central location. • Trust nobody. • Do not trust CSRs, Dealers and Sales People. • Do not trust the Billing / Service Order System. • Do not trust Analysts writing their own business rules. • Do not trust Vendors who want to write business rules from scratch. • Get rid of all hard coded business rules. • Do not hard code definitions for activations, churn, de-re, etc. • Do not hard code links between “like” products for upgrade/downgrade analysis. • Always provide an audit trail. • How did we get from one subscriber state to another? • Do we tie back to the ending counts in the billing system? • Do we tie back to our company’s official business rules?
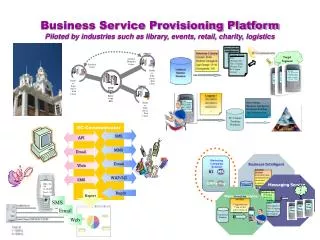
Data Warehouse/Data Marts Revenue/Usage Subscriber Profile Subscriber Cost Daily Activity Subscriber Profitability Customer Contact Data Mining Relational Queries Subscriber Activity: Carrier Success Billing System(s) [original source of unit data] Daily/Monthly subscriber change/snapshot records Canned Reports All Business Rules applied relationally at subscriber/service level using table based approach Customer Lists Commissions Welcome Letters Revenue / Usage Actuals Subscriber Activity Revenue Plan / Forecast Actual/plan information shared between cubes EIS/Dashboards Excel Templates
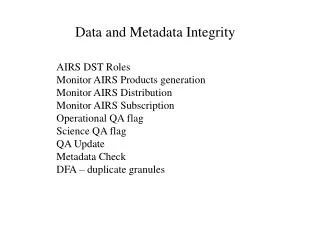
State Subscriber Table Product Map Houses Customer Snapshot On All Change Dates (Not One Record Every Day = Huge) Product Family Rank A 1 5 B 1 10 C 1 1 D 2 3 OK Business Rules Table Daily Activity Table True Customer Transactions Based on Carrier’s Business Rules: Not the way the Billing System forces CSR to enter it as it only has three work order types. Not the way the sneaky Sales Person coded it to try to get an extra commission Status: A Previous Status: C Period: < 30 Days Metric: Reactivation OK Subscriber Activity: Carrier Success Source Systems • Methodology • Change Data Capture: End of Day State Today – End of Day State Yesterday • Generates: • Customers In/Out • Products/Plans In/Out for Existing Customers • Attribute Changes (Credit Score, Modem ESN, Customer Segment, etc.) • Apply Customer Matching/Phantom Churn Rules to link together Customers the Billing System thinks are separate • Business Rules defined cross-departmentally are also table based • Product Map/Catalog links together disconnects/connects of like products and turns them into upgrades/downgrades • Weekly/Monthly Trueup ensures ending counts = source system • Automatic Balancing ensures Beginning + Net Activity = Ending
Subscriber Activity: Customer Success • Ability to leverage best practices for subscriber analysis from other telecommunications carriers. • Deployment of solution that will allow for table-based business rule changes rather than requiring IT intervention/coding • Implement a superior approach to subscriber activity reporting by eliminating “adding up service order” approach • Obtaining deeper insight into subscriber activity (i.e., if 500 new instances of High Speed Data were added yesterday): • How many HSD instances were added due to new subscriber connects? • How many HSD instances were added as part of a reconnect? • How many HSD instances were added to existing subscribers that formerly had HSD? • How many HSD instances were added to existing subscribers for the first time? • How many HSD instances were added due to a downgrade in service from a internet bundle?
Subscriber Activity: Customer Success • Ability to answer questions such as: • How many access line disconnects were part of an upgrade to DSL? • How many customers took advantage of a promotion to activate a new product code, but were simply sidegrades from an existing product (cannibalization) ? • How many customers “surf” promotions (connect/disconnect the same product each time a promotional campaign starts/finishes) ? • How many customers have a particular product on a la carte basis, either full price, or at a 15% or 25% discount? How many have the same product in a bundle? • Providing audit trail for tracking back reported statistics to source data • In the event of an audit, or executive questioning the reported numbers, the system will allow users to “track back” the reported numbers through the business rules to the source billing system data. • Enhancing EDW’s power in providing the single source “one version of the truth” for subscriber activity metrics, removing business rules and inconsistencies from dashboards, reporting/query tools, reports, etc.
Subscriber Activity: Customer Success • 5 million subscriber wireless carrier identified $2.1 million/year in overpaid commissions due to De-Re process not caught by previous reporting process. • 1 million access line fixed line carrier reduced commissions in residential call center by 15% due to Feature Spins (In/Out on similar products) not caught by previous reporting process. • 1 million subscriber wireless carrier reduced involuntary churn by identifying credit classes with extremely high non-payment frequency and reps activating low credit customers. Reduced bad debt write-off by $1.1 million/year, commission payments by $250,000/year. Customers with identified credit profiles now offered prepaid service only. • 250,000 subscriber wireless carrier identified commission overpayments of $600,000/year, which were eliminated. • 1 million subscriber wireless carrier eliminated redundant reports produced by billing company. Cost savings of $350,000/year
Thank You For Your Attention! Simon MarwoodPresident – Scorecard Systems Inc. Toronto, Canada / London, UK / Galway, Ireland / Sao Paulo, Brazil smarwood@scorecardsystems.com +1 416 580 2416 / +44 791 346 8120