Download
1 / 18
180 likes | 260 Views
http://www.nytimes.com/2009/01/07/technology/business-computing/07program.html?pagewanted=all. Data Structures. character vector. numeric vector. Dataframe :

E N D
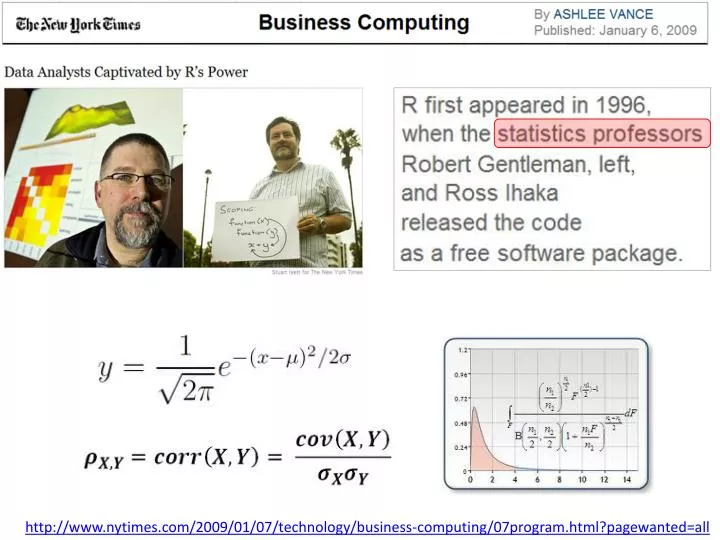
http://www.nytimes.com/2009/01/07/technology/business-computing/07program.html?pagewanted=allhttp://www.nytimes.com/2009/01/07/technology/business-computing/07program.html?pagewanted=all
Data Structures character vector numeric vector Dataframe: d <- c(1,2,3,4)e <- c("red", "white", "red", NA)f <- c(TRUE,TRUE,TRUE,FALSE)mydata <- data.frame(d,e,f)names(mydata) <- c("ID","Color","Passed") List: w <- list(name="Fred", age=5.3) Numeric Vector: a <- c(1,2,5.3,6,-2,4) Character Vector: b <- c("one","two","three") Framework Source: Hadley Wickham Matrix: y<-matrix(1:20, nrow=5,ncol=4)
Sample Script (1) Data Input (2) Statistical Function (3a) Graphical Parameters (3b) Plot Function
Currently, how many R Packages? At the command line enter: • dim(available.packages()) • available.packages()
Course Some Coverage Specialized “Domain” stats graphics (both built-in) Bayesian DifferentialEquations Econometrics Environmetrics ExperimentalDesign Finance Genetics HighPerformanceComputing MachineLearning MedicalImaging NaturalLanguageProcessing Pharmacokinetics Phylogenetics Psychometrics SocialSciences Spatial TimeSeries Data Management plyr reshape Graphics ggplot2
R Packages have been created that are equivalent to the functionality of SAS and SPSS
Packages for reading, writing for various data sources and file formats XLConnect sas7bdat Comma Separated Variables Hmisc foreign XML RMySQL RODBC / ROracle RJSONIO RWeka rhbase Rcpp
Example of an Specialized Package for Social Network Analysis tnet
Comprehensive R Archive Network http://cran.r-project.org/web/views/
R Data Visualization http://gallery.r-enthusiasts.com/
The R Graphics Package library(help="graphics") • Graphing Parameters • Basic Chart Types Titles X-Axis Title Y-Axis Title Legend Scales Color Gridlines
The next data visual was produced with about 150 lines of R code