Download
1 / 1
10 likes | 126 Views
Performance of Graph and Biological Analytics on the IBM Cell Broadband Engine Processor. SPU. SPU. SPU. SPU. SPU. SPU. SPU. SPU. SXU. SXU. SXU. SXU. SXU. SXU. SXU. SXU. LS. LS. LS. LS. LS. LS. LS. LS. SMF. SMF. SMF. SMF. SMF. SMF. SMF. SMF. PPU. L1. PXU.

E N D
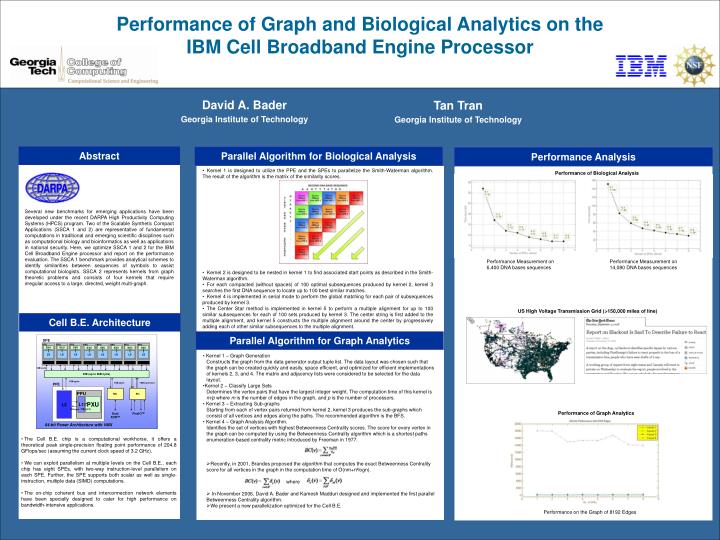
Performance of Graph and Biological Analytics on the IBM Cell Broadband Engine Processor SPU SPU SPU SPU SPU SPU SPU SPU SXU SXU SXU SXU SXU SXU SXU SXU LS LS LS LS LS LS LS LS SMF SMF SMF SMF SMF SMF SMF SMF PPU L1 PXU 16B/cycle David A. Bader Georgia Institute of Technology Tan Tran Georgia Institute of Technology Abstract Parallel Algorithm for Biological Analysis Performance Analysis Several new benchmarks for emerging applications have been developed under the recent DARPA High Productivity Computing Systems (HPCS) program. Two of the Scalable Synthetic Compact Applications (SSCA 1 and 2) are representative of fundamental computations in traditional and emerging scientific disciplines such as computational biology and bioinformatics as well as applications in national security. Here, we optimize SSCA 1 and 2 for the IBM Cell Broadband Engine processor and report on the performance evaluation. The SSCA 1 benchmark provides analytical schemes to identify similarities between sequences of symbols to assist computational biologists. SSCA 2 represents kernels from graph theoretic problems and consists of four kernels that require irregular access to a large, directed, weight multi-graph. • Kernel 1 is designed to utilize the PPE and the SPEs to parallelize the Smith-Waterman algorithm. The result of the algorithm is the matrix of the similarity scores. • Kernel 2 is designed to be nested in kernel 1 to find associated start points as described in the Smith-Waterman algorithm. • For each compacted (without spaces) of 100 optimal subsequences produced by kernel 2, kernel 3 searches the first DNA sequence to locate up to 100 best similar matches. • Kernel 4 is implemented in serial mode to perform the global matching for each pair of subsequences produced by kernel 3. • The Center Star method is implemented in kernel 5 to perform a multiple alignment for up to 100 similar subsequences for each of 100 sets produced by kernel 3. The center string is first added to the multiple alignment, and kernel 5 constructs the multiple alignment around the center by progressively adding each of other similar subsequences to the multiple alignment. Performance of Biological Analysis Performance Measurement on 6,400 DNA bases sequences Performance Measurement on 14,080 DNA bases sequences US High Voltage Transmission Grid (>150,000 miles of line) Cell B.E. Architecture Parallel Algorithm for Graph Analytics SPE • Kernel 1 – Graph Generation • Constructs the graph from the data generator output tuple list. The data layout was chosen such that the graph can be created quickly and easily, space efficient, and optimized for efficient implementations of kernels 2, 3, and 4. The matrix and adjacency lists were considered to be selected for the data layout. • Kernel 2 – Classify Large Sets • Determines the vertex pairs that have the largest integer weight. The computation time of this kernel is m/p where m is the number of edges in the graph, and p is the number of processors. • Kernel 3 – Extracting Sub-graphs • Starting from each of vertex pairs returned from kernel 2, kernel 3 produces the sub-graphs which consist of all vertices and edges along the paths. The recommended algorithm is the BFS. • Kernel 4 – Graph Analysis Algorithm. • Identifies the set of vertices with highest Betweenness Centrality scores. The score for every vertex in the graph can be computed by using the Betweenness Centrality algorithm which is a shortest paths enumeration-based centrality metric introduced by Freeman in 1977. • Recently, in 2001, Brandes proposed the algorithm that computes the exact Betweenness Centrality score for all vertices in the graph in the computation time of O(nm+n²logn). • where • In November 2006, David A. Bader and KameshMadduri designed and implemented the first parallel Betweenness Centrality algorithm. • We present a new parallelization optimized for the Cell B.E. 16B/cycle EIB (up to 96B/cycle) 16B/cycle 16B/cycle 16B/cycle (2x) PPE MIC BIC L2 32B/cycle Performance of Graph Analytics Dual XDRTM FlexIOTM 64-bit Power Architecture with VMX • The Cell B.E. chip is a computational workhorse, it offers a theoretical peak single-precision floating point performance of 204.8 GFlops/sec (assuming the current clock speed of 3.2 GHz). • We can exploit parallelism at multiple levels on the Cell B.E., each chip has eight SPEs, with two-way instruction-level parallelism on each SPE. Further, the SPE supports both scalar as well as single-instruction, multiple data (SIMD) computations. • The on-chip coherent bus and interconnection network elements have been specially designed to cater for high performance on bandwidth-intensive applications. Performance on the Graph of 8192 Edges