Download

1 / 93
980 likes | 1.26k Views
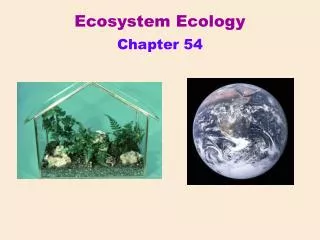
Chapter 54. Ecosystems. Overview: Ecosystems, Energy, and Matter. An ecosystem consists of all the organisms living in a community, as well as the abiotic factors with which they interact Ecosystems range from a microcosm, such as an aquarium, to a large area such as a lake or forest. LE 54-2.

E N D
Chapter 54 Ecosystems
Overview: Ecosystems, Energy, and Matter • An ecosystem consists of all the organisms living in a community, as well as the abiotic factors with which they interact • Ecosystems range from a microcosm, such as an aquarium, to a large area such as a lake or forest
LE 54-2 Tertiary consumers Microorganisms and other detritivores Secondary consumers Primary consumers Detritus Primary producers Heat Key Chemical cycling Sun Energy flow
Concept 54.2: Physical and chemical factors limit primary production in ecosystems • Primary production in an ecosystem is the amount of light energy converted to chemical energy by autotrophs during a given time period
Gross and Net Primary Production • Total primary production is known as the ecosystem’s gross primary production (GPP) • Net primary production (NPP) is GPP minus energy used by primary producers for respiration • Only NPP is available to consumers • Ecosystems vary greatly in net primary production and contribution to the total NPP on Earth
LE 54-4 Net Primary Production of Different Ecosystems Open ocean Continental shelf 125 65.0 24.4 360 5.2 5.6 1,500 Estuary Algal beds and reefs 1.2 0.3 0.1 0.1 0.9 2,500 Upwelling zones Extreme desert, rock, sand, ice 0.1 500 4.7 0.04 3.0 Desert and semidesert scrub Tropical rain forest 3.5 90 0.9 22 3.3 2,200 Savanna Cultivated land 2.9 7.9 900 2.7 9.1 600 Boreal forest (taiga) Temperate grassland 2.4 9.6 800 1.8 5.4 600 Woodland and shrubland Tundra 1.7 3.5 700 1.6 140 0.6 Tropical seasonal forest 1.5 7.1 1,600 Temperate deciduous forest Temperate evergreen forest 1,200 4.9 1.3 1,300 3.8 1.0 Swamp and marsh Lake and stream 2.3 2,000 0.4 0.4 0.3 250 20 0 20 50 0 15 40 60 10 10 30 5 25 0 1,000 2,500 500 1,500 2,000 Key Percentage of Earth’s surface area Average net primary production (g/m2/yr) Percentage of Earth’s net primary production Marine Terrestrial Freshwater (on continents)
Overall, terrestrial ecosystems contribute about two-thirds of global NPP • Marine ecosystems contribute about one-third
LE 54-5 Annual Net Primary Production North Pole 60°N 30°N Equator 30°S 60°S South Pole 120°W 180° 60°W 60°E 0° 180° 120°E
LE 54-6 30 21 Long Island Shinnecock Bay 19 15 5 11 Moriches Bay 4 Great South Bay Atlantic Ocean 2 Coast of Long Island, New York Phytoplankton 8 8 7 7 Inorganic phosphorus 6 6 5 5 Phytoplankton (millions of cells/mL) Inorganic phosphorus (µm atoms/L) 4 4 3 3 2 2 1 1 0 0 30 4 11 15 21 2 19 5 Station number Shinnecock Bay Great South Bay Moriches Bay Phytoplankton biomass and phosphorus concentration 30 Ammonium enriched Phosphate enriched Unenriched control 24 18 Phytoplankton (millions of cells per mL) 12 6 0 Starting algal density 30 4 11 15 2 19 21 5 Station number Phytoplankton response to nutrient enrichment
The addition of large amounts of nutrients to lakes has a wide range of ecological impacts • In some areas, sewage runoff has caused eutrophication of lakes, which can lead to loss of most fish species.
Gulf of Mexico Dead Zone • The Gulf of Mexico experiences a large Dead Zone. • Nutrients, mainly nitrogen, are contained in agricultural runoff. Excess nitrogen causes algal blooms (picture). • These then lead to low oxygen (hypoxic) conditions when the algae decay, removing oxygen from the water.
LE 54-8 3,000 Tropical forest 2,000 Net primary production (g/m2/yr) Temperate forest 1,000 Mountain coniferous forest Desert shrubland Temperate grassland Arctic tundra 0 1,500 0 500 1,000 Actual evapotranspiration (mm/yr)
LE 54-10 Plant material eaten by caterpillar 200 J 67 J Cellular respiration 100 J Feces 33 J Growth (new biomass)
Idealized Energy Pyramid of Net Production LE 54-11 Tertiary consumers 10 J Secondary consumers 100 J Primary consumers 1,000 J Primary producers 10,000 J 1,000,000 J of sunlight
Pyramids of Biomass • In a biomass pyramid, each tier represents the dry weight of all organisms in one trophic level • Most biomass pyramids show a sharp decrease at successively higher trophic levels
LE 54-12a Biomass Pyramid Trophic level Dry weight (g/m2) Tertiary consumers Secondary consumers Primary consumers Primary producers 1.5 11 37 809 Most biomass pyramids show a sharp decrease in biomass at successively higher trophic levels, as illustrated by data from a bog at Silver Springs, Florida.
Certain aquatic ecosystems have inverted biomass pyramids: Primary consumers outweigh the producers. • Phytoplankton have a short turnover time; they replace their biomass at a rapid rate.
LE 54-12b Trophic level Dry weight (g/m2) 21 4 Primary consumers (zooplankton) Primary producers (phytoplankton) In some aquatic ecosystems, such as the English Channel, a small standing crop of primary producers (phytoplankton) supports a larger standing crop of primary consumers (zooplankton).
LE 54-13 Pyramids of Numbers Trophic level Number of individual organisms Tertiary consumers Secondary consumers Primary consumers Primary producers 3 354,904 708,624 5,842,424
Dynamics of energy flow in ecosystems have important implications for the human population • Eating meat is a relatively inefficient way of tapping photosynthetic production • Worldwide agriculture could feed many more people if humans ate only plant material
LE 54-14 Trophic level Secondary consumers Primary consumers Primary producers
Water Cycle LE 54-17a Transport over land Solar energy Net movement of water vapor by wind Precipitation over land Precipitation over ocean Evaporation from ocean Evapotranspiration from land Percolation through soil Runoff and groundwater
Carbon Cycle LE 54-17b CO2 in atmosphere Photosynthesis Cellular respiration Burning of fossil fuels and wood Higher-level consumers Primary consumers Carbon compounds in water Detritus Decomposition
Nitrogen Cycle LE 54-17c N2 in atmosphere Assimilation Denitrifying bacteria NO3– Nitrogen-fixing bacteria in root nodules of legumes Decomposers Nitrifying bacteria Ammonification Nitrification NH3 NH4+ NO2– Nitrogen-fixing soil bacteria Nitrifying bacteria
Phosphorous Cycle LE 54-17d Rain Geologic uplift Weathering of rocks Plants Runoff Consumption Sedimentation Plant uptake of PO43– Soil Leaching Decomposition
LE 54-18 Consumers Producers Decomposers Nutrients available to producers Abiotic reservoir Geologic processes
LE 54-19 Concrete dams and weirs built across streams at the bottom of watersheds enabled researchers to monitor the outflow of water and nutrients from the ecosystem. One watershed was clear cut to study the effects of the loss of vegetation on drainage and nutrient cycling. 80.0 Deforested 60.0 40.0 20.0 Nitrate concentration in runoff (mg/L) Completion of tree cutting 4.0 Control 3.0 2.0 1.0 0 1966 1968 1965 1967 The concentration of nitrate in runoff from the deforested watershed was 60 times greater than in a control (unlogged) watershed.
Acid Precipitation • Combustion of fossil fuels is the main cause of acid precipitation • North American and European ecosystems downwind from industrial regions have been damaged by rain and snow containing nitric and sulfuric acid
Average Precipitation pH LE 54-22 5.0 5.3 5.1 5.4 5.6 5.5 5.2 5.3 6.1 5.2 4.8 5.3 4.7 5.3 4.5 4.6 5.4 5.1 5.5 5.2 5.2 5.2 5.0 4.8 5.2 4.7 4.6 5.2 4.5 4.8 4.9 4.3 5.2 4.5 4.5 5.5 5.5 4.5 5.6 4.7 4.5 5.2 4.6 4.9 5.6 4.5 4.7 5.3 5.4 4.3 5.3 4.4 4.5 5.5 4.6 5.1 4.7 4.6 4.5 4.7 5.4 6.0 4.5 4.4 4.1 4.4 5.3 5.3 4.8 4.4 5.5 4.6 5.9 4.3 4.6 4.6 4.6 5.3 4.5 4.4 5.4 4.5 5.1 4.7 6.3 4.5 4.5 5.0 4.5 5.3 4.7 5.2 4.7 4.6 5.6 5.3 4.8 5.1 4.9 5.4 5.0 5.7 4.6 5.4 4.6 4.8 5.4 4.5 4.6 4.5 5.0 4.9 4.5 4.7 4.8 4.9 4.5 4.6 5.4 4.5 Field pH 5.3 4.7 4.5 4.7 5.0 4.7 4.8 5.7 4.7 5.0 4.8 4.7 5.0 5.3 5.1 5.2 4.7 5.2–5.3 5.1–5.2 5.0–5.1 4.9–5.0 4.8–4.9 4.7–4.8 4.6–4.7 4.5–4.6 4.4–4.5 4.3–4.4 <4.3 4.7 5.0 5.0 5.4 4.7 5.0 4.6 4.7 4.9 5.4 5.1 4.8 4.7 4.8 5.1 5.3 4.8 4.9 4.8 4.7 5.7 4.9 4.8 4.7 5.1 4.7 4.8 5.0 4.7 5.0 4.7 4.9
LE 54-21 4.6 4.3 4.6 4.3 4.6 4.1 4.3 4.6 Europe North America
Toxins in the Environment • Humans release many toxic chemicals, including synthetics previously unknown to nature • In some cases, harmful substances persist for long periods in an ecosystem • One reason toxins are harmful is that they become more concentrated in successive trophic levels • In biological magnification, toxins concentrate at higher trophic levels, where biomass is lower
Biological Magnification LE 54-23 Herring gull eggs 124 ppm Lake trout 4.83 ppm Concentration of PCBs Smelt 1.04 ppm Zooplankton 0.123 ppm Phytoplankton 0.025 ppm
Depletion of Atmospheric Ozone • Life on Earth is protected from damaging effects of UV radiation by a protective layer or ozone molecules in the atmosphere • Satellite studies suggest that the ozone layer has been gradually thinning since 1975
LE 54-26 350 300 250 200 Ozone layer thickness (Dobson units) 150 100 50 0 1965 1985 1995 1960 2005 1955 1975 1980 1990 2000 1970 Year (Average for the month of October)
LE 54-27 Chlorine from CFCs interacts with ozone (O3), forming chlorine monoxide (CIO) and oxygen (O2). Chlorine atoms O2 O3 Chlorine CIO O2 Sunlight causes Cl2O2 to break down into O2 and free chlorine atoms. The chlorine atoms can begin the cycle again. CIO Two CIO molecules react, forming chlorine peroxide (Cl2O2). Cl2O2 Sunlight
LE 54-28 October 1979 October 2000
CO2 in the atmosphere, 1958-2004Courtesy: Scripps Institution of Oceanography
Image courtesy of the Whitehouse Initiative on Global Climate Change.
Graph derived from data extracted from an ice core recovered from the Vostok Station in Antarctica Image Source: http://earthobservatory.nasa.gov/Study/TimeShelf/time_shelf4.html
AcknowledgementsThe Sea Ice Index was developed by F. Fetterer, K. Knowles, and NSIDC staff with financial support from NOAA National Environmental Satellite, Data, and Information Service (NESDIS), and in cooperation with the NOAA National Geophysical Data Center (NGDC).Citing the Sea Ice IndexPlease use the citation below when referencing the Sea Ice Index.Fetterer, F. and K. Knowles. 2002, updated 2004. Sea Ice Index. Boulder, CO: National Snow and Ice Data Center. Digital media. http://nsidc.org/data/seaice_index/