Download

1 / 52
520 likes | 719 Views
Chapter 54. Ecosystems. Overview: Observing Ecosystems. An ecosystem consists of all the organisms living in a community, as well as the abiotic factors with which they interact Ecosystems range from a microcosm, such as an aquarium, to a large area such as a lake or forest.

E N D
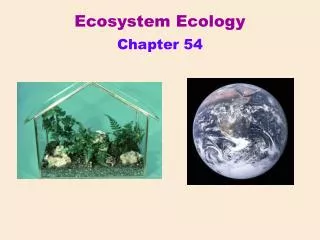
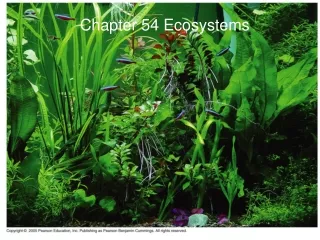
Chapter 54 Ecosystems
Overview: Observing Ecosystems • An ecosystem consists of all the organisms living in a community, as well as the abiotic factors with which they interact • Ecosystems range from a microcosm, such as an aquarium, to a large area such as a lake or forest
Regardless of an ecosystem’s size, its dynamics involve two main processes: energy flow and chemical cycling • Energy flows through ecosystems while matter cycles within them
Concept 55.1: Physical laws govern energy flow and chemical cycling in ecosystems • Ecologists study the transformations of energy and matter within their system
Lab Dissolved Oxygen • Dissolved oxygen is waters ability to hold oxygen • Air has 95% more oxygen • Respiration and organic breakdown depletes oxygen
Fig. 55-4 Tertiary consumers Microorganisms and other detritivores Secondary consumers Primary consumers Detritus Primary producers Heat Key Chemical cycling Sun Energy flow
Fig. 55-10 Tertiary consumers 10 J Secondary consumers 100 J Primary consumers 1,000 J Primary producers 10,000 J 1,000,000 J of sunlight
Physical Factors that effect soluble oxygen • Temp increases D.0. decreases • Wind increases D.O. increases • Turbulence increases D.0. increases • Minerals increase D.O. decreases • Pressure increases D.O. increases
Concept 55.2: Energy and other limiting factors control primary production in ecosystems • Primary productivity in an ecosystem is the amount of light energy converted to chemical energy by autotrophs during a given time period
Ecosystem Energy Budgets • The extent of photosynthetic production sets the spending limit for an ecosystem’s energy budget
Fig. 55-6 · Net primary production (kg carbon/m2·yr) 0 1 3 2
Tropical rain forests, estuaries, and coral reefs are among the most productive ecosystems per unit area • Marine ecosystems are relatively unproductive per unit area, but contribute much to global net primary production because of their volume
Gross and Net Primary Production • Total primary production is known as the ecosystem’s gross primary production (GPP) • Net primary production (NPP) is GPP minus energy used by primary producers for respiration • Only NPP is available to consumers
Primary Production in Aquatic Ecosystems • In marine and freshwater ecosystems, both light and nutrients control primary production
Nutrient Limitation • A limiting nutrient is the element that must be added for production to increase in an area • Nitrogen and phosphorous are typically the nutrients that most often limit marine production • Nutrient enrichment experiments confirmed that nitrogen was limiting phytoplankton growth off the shore of Long Island, New York
The addition of large amounts of nutrients to lakes has a wide range of ecological impacts • In some areas, sewage runoff has caused eutrophication of lakes, which can lead to loss of most fish species Video: Cyanobacteria (Oscillatoria)
How do you determine primary productivity ? • The Winkler Method measures Oxygen in ppm • A healthy pond 8 -15 ppm different fish need different amounts of oxygen Conversion is made ml O2/l = 0.698 x mg O2/l mg C/l = 0.536 x ml 02/l
Concept 55.4: Biological and geochemical processes cycle nutrients between organic and inorganic parts of an ecosystem • Life depends on recycling chemical elements • Nutrient circuits in ecosystems involve biotic and abiotic components and are often called biogeochemical cycles
In studying cycling of water, carbon, nitrogen, and phosphorus, ecologists focus on four factors: • Each chemical’s biological importance • Forms in which each chemical is available or used by organisms • Major reservoirs for each chemical • Key processes driving movement of each chemical through its cycle
The Water Cycle • Water is essential to all organisms • 97% of the biosphere’s water is contained in the oceans, 2% is in glaciers and polar ice caps, and 1% is in lakes, rivers, and groundwater • Water moves by the processes of evaporation, transpiration, condensation, precipitation, and movement through surface and groundwater
Fig. 55-14a Transport over land Solar energy Net movement of water vapor by wind Precipitation over land Precipitation over ocean Evaporation from ocean Evapotranspiration from land Percolation through soil Runoff and groundwater
The Carbon Cycle • Carbon-based organic molecules are essential to all organisms • Carbon reservoirs include fossil fuels, soils and sediments, solutes in oceans, plant and animal biomass, and the atmosphere • CO2 is taken up and released through photosynthesis and respiration; additionally, volcanoes and the burning of fossil fuels contribute CO2 to the atmosphere
Fig. 55-14b CO2 in atmosphere Photosynthesis Cellular respiration Photo- synthesis Burning of fossil fuels and wood Phyto- plankton Higher-level consumers Primary consumers Carbon compounds in water Detritus Decomposition
The Terrestrial Nitrogen Cycle • Nitrogen is a component of amino acids, proteins, and nucleic acids • The main reservoir of nitrogen is the atmosphere (N2), though this nitrogen must be converted to NH4+ or NO3– for uptake by plants, via nitrogen fixation by bacteria
Organic nitrogen is decomposed to NH4+ by ammonification, and NH4+ is decomposed to NO3– by nitrification • Denitrification converts NO3– back to N2
Fig. 55-14c N2 in atmosphere Assimilation Denitrifying bacteria NO3 – Nitrogen-fixing bacteria Decomposers Nitrifying bacteria Ammonification Nitrification NH3 NH4 NO2 – + Nitrogen-fixing soil bacteria Nitrifying bacteria
The Phosphorus Cycle • Phosphorus is a major constituent of nucleic acids, phospholipids, and ATP • Phosphate (PO43–) is the most important inorganic form of phosphorus • The largest reservoirs are sedimentary rocks of marine origin, the oceans, and organisms • Phosphate binds with soil particles, and movement is often localized
Fig. 55-14d Precipitation Geologic uplift Weathering of rocks Runoff Consumption Decomposition Plant uptake of PO43– Plankton Dissolved PO43– Soil Uptake Leaching Sedimentation
Decomposition and Nutrient Cycling Rates • Decomposers (detritivores) play a key role in the general pattern of chemical cycling • Rates at which nutrients cycle in different ecosystems vary greatly, mostly as a result of differing rates of decomposition • The rate of decomposition is controlled by temperature, moisture, and nutrient availability • Rapid decomposition results in relatively low levels of nutrients in the soil
Ends Chapter 54 • Continue to review environmental concerns
Acid Precipitation • Combustion of fossil fuels is the main cause of acid precipitation • North American and European ecosystems downwind from industrial regions have been damaged by rain and snow containing nitric and sulfuric acid • Acid precipitation changes soil pH and causes leaching of calcium and other nutrients
Environmental regulations and new technologies have allowed many developed countries to reduce sulfur dioxide emissions
Fig. 55-19 4.5 4.4 4.3 pH 4.2 4.1 4.0 1970 1975 1990 1960 1965 1980 1985 1995 2000 Year
Toxins in the Environment • Humans release many toxic chemicals, including synthetics previously unknown to nature • In some cases, harmful substances persist for long periods in an ecosystem • One reason toxins are harmful is that they become more concentrated in successive trophic levels • Biological magnification concentrates toxins at higher trophic levels, where biomass is lower
PCBs and many pesticides such as DDT are subject to biological magnification in ecosystems • In the 1960s Rachel Carson brought attention to the biomagnification of DDT in birds in her book Silent Spring
Fig. 55-20 Herring gull eggs 124 ppm Lake trout 4.83 ppm Concentration of PCBs Smelt 1.04 ppm Zooplankton 0.123 ppm Phytoplankton 0.025 ppm
Greenhouse Gases and Global Warming • One pressing problem caused by human activities is the rising level of atmospheric carbon dioxide
Rising Atmospheric CO2 Levels • Due to the burning of fossil fuels and other human activities, the concentration of atmospheric CO2 has been steadily increasing
Fig. 55-21 14.9 390 14.8 380 14.7 14.6 370 Temperature 14.5 360 14.4 14.3 350 CO2 concentration (ppm) Average global temperature (ºC) 14.2 340 14.1 CO2 330 14.0 13.9 320 13.8 310 13.7 13.6 300 1960 1965 1970 1975 1980 1985 1990 1995 2000 2005 Year
How Elevated CO2 Levels Affect Forest Ecology: The FACTS-I Experiment • The FACTS-I experiment is testing how elevated CO2 influences tree growth, carbon concentration in soils, and other factors over a ten-year period • The CO2-enriched plots produced more wood than the control plots, though less than expected • The availability of nitrogen and other nutrients appears to limit tree growth and uptake of CO2
The Greenhouse Effect and Climate • CO2, water vapor, and other greenhouse gases reflect infrared radiation back toward Earth; this is the greenhouse effect • This effect is important for keeping Earth’s surface at a habitable temperature • Increased levels of atmospheric CO2 are magnifying the greenhouse effect, which could cause global warming and climatic change
Increasing concentration of atmospheric CO2 is linked to increasing global temperature • Northern coniferous forests and tundra show the strongest effects of global warming • A warming trend would also affect the geographic distribution of precipitation
Global warming can be slowed by reducing energy needs and converting to renewable sources of energy • Stabilizing CO2 emissions will require an international effort
Depletion of Atmospheric Ozone • Life on Earth is protected from damaging effects of UV radiation by a protective layer of ozone molecules in the atmosphere • Satellite studies suggest that the ozone layer has been gradually thinning since 1975
Fig. 55-23 350 300 250 Ozone layer thickness (Dobsons) 200 100 0 ’60 ’80 1955 ’70 ’75 ’85 ’90 ’95 ’05 ’65 2000 Year
Destruction of atmospheric ozone probably results from chlorine-releasing pollutants such as CFCs produced by human activity
Fig. 55-24 Chlorine atom O2 O3 Chlorine ClO O2 ClO Cl2O2 Sunlight
Scientists first described an “ozone hole” over Antarctica in 1985; it has increased in size as ozone depletion has increased