Download

1 / 34
340 likes | 343 Views
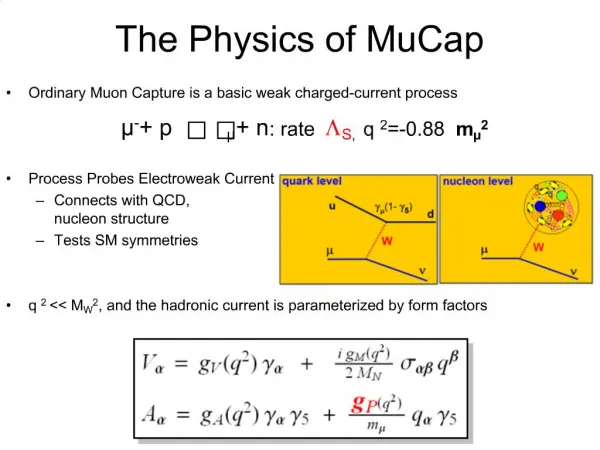
UIUC MuCap Run8 Analysis. MuCap Collaboration Meeting at UC-Berkeley February 27 – March 1, 2006. Steven Clayton University of Illinois. Outline. Mu Event Display explanation Old muon stop definition New muon stop definition TPC event classification Extra EL pixels in TPC

E N D
UIUC MuCap Run8 Analysis MuCap Collaboration Meeting at UC-Berkeley February 27 – March 1, 2006 Steven Clayton University of Illinois
Outline • Mu Event Display explanation • Old muon stop definition • New muon stop definition • TPC event classification • Extra EL pixels in TPC • Some lifetime fit results
How to read the Mu Event Display Data from the TDC400s are displayed, along with certain CAEN channels receiving muon counter signals. Strip hits: low threshold (EL), high threshold (EH) TPC Strip Numbers [1-35], offset by 80 These boxes represent the TPC fiducial region based on a muSC hit. Anode hits: low threshold (EL), high threshold (EH), very high threshold (EVH) TPC Anode Numbers [1-75] This axis is the time of the data with respect to the beginning of the display time window. Therefore, to find the Y-position of a TPC track, subtract the time of the muSC hit (5000 ns in this case) and multiply by the drift velocity (~0.005 mm/ns). Hits in the muon counters: muSC, muPC-X, muPC-Y The absolute time, within the DAQ live-time, of the zero of the displayed time axis.
m- Production Data Observed Decay Rate Gondola Old Muon Stop Definition 1 • Strong “Gondola Effect”* *The “gondola effect” is a large (anomalous) variation with gondola number of the fitted muon decay rate.
Old Muon Stop Definition 2 Effectively, the old muon stop definition does the following: • Projects all TDC400 hits onto the time-axis, finds clusters in time. • For clusters with at least one EH pixel, does a linear regression fit to the EL pixels. • The cluster is considered a good stop if: • The chi-squared/(Number of EL pixels) of the linear fit is sufficiently low, and there are enough EL pixels to judge. • There are EH pixels near the downstream end. • All EL pixels must be within the fiducial volume, and all EH pixels must be within a somewhat tighter fiducial volume. This procedure is adequate for most muon stops (~95 % (?)). As will be shown later in this presentation, of the stops that are rejected, some are done so in a decay-time-dependant way!
Old Muon Stop Definition 3 • Rejected TPC stops (“Bad Tracks”) have the opposite trend. “All Tracks” in the old stop definition means a good linear fit to the track shape is not required, and the EH pixels do not have to be anywhere in particular in the track. The only cut is a fiducial one. “All Tracks” do not show a significant gondola effect!
Tom’s Version of the “Gondola Effect” • Largely reduced compared to mine, but still present.
1) Define a Region of Interest (ROI) of TPC data based on the muon entrance counters [Tentrance, Tentrance + 25 ms] New MIAS Muon Stop Definition 1 Goal of new stop definition: to be more robust against noise and distorted tracks, and to identify tracks that need more attention. 2) Within the ROI, find all groups of next-nearest-neighbor connected EL pixels, in pixel space, with at least one EH pixel.* “Island” of pixels “Raw data” pixels Pixels that are part of this island are indicated by a square around the dot. In this case, all pixels shown are part of the same island. The long line and large blue and green squares (1 each) are explained on the next slide. * “Pixel Space” is the 2-dimensional space of: (drift time divided by TDC400 clock period, anode number); it corresponds to spatial (y, z) coordinates.
New MIAS Muon Stop Definition 2 3) Identify if the island is a good stop (“IsTrack”). • Define some island characteristics: • maximum anode number of EL pixels (AnodeMaxEL) • maximum anode number of EH pixels (AnodeMaxEH) • minimum anode number of EL pixels (AnodeMinEL) • minimum anode number of EH pixels (AnodeMinEH) • These maxima/minima anode numbers (and similarly for the drift time dimension) are indicated by the large squares (green for EL pixels, blue for EH pixels). • An island is a track if: • AnodeMaxEL – AnodeMaxEH <= 2 • AnodeMinEH – AnodeMinEL >= 8 • In other words, “IsTrack” is a minimal cut and means: • the track cannot extend too far beyond the apparent stop point (EH pixels), • and it also must have a sufficient tail leading up to the stop point. If an island is found to be a track (IsTrack), then a line is fit to the pixels for possible cuts or beam (y, y’) studies. The (y, z) stop location is defined as that of the most downstream EH pixel, the one with the minimum drift time.
New MIAS Muon Stop Definition 3 4) If the island is not a track (“!IsTrack”), check if it is a spot (“IsSpot”) An island is a spot if: AnodeMaxEL – AnodeMaxEH <= 2 AnodeMinEH – AnodeMinEL <= 2 DriftTimeMinEH – DriftTimeMinEL <= 3 (?) DriftTimeMaxEL – DriftTimeMaxEH <= 3 (?) The (y, z) location of the spot is defined as the average of the EVH pixels if present, otherwise of the EH pixels. (This may be changed to be the average of the earliest EVH or EH pixels.)
New MIAS Muon Stop Definition 4 Location in x (strips dimension) Y (Drift Time) found from anodes • Stop x is taken to be the average of the strips that have a hit at the stop time (Tstop) determined from the anodes. • The maximum and minimum x of the muon stop are based on strips hit at Tstop, Tstop+1 and Tstop-1.
TPC Event Categories 2 Extra EL pixel in Region of Interest (ROI) Occasionally (~2% of good stops), there are one or more EL pixels, unassociated with any EH-containing island, and downstream of the beginning of the muon track.* Z (anode number) Z (anode number) Y (or Drift Time) Y (or Drift Time) * Most of the “extra EL pixels” upstream of the beginning of the track are merely from when the muon had not yet sufficiently slowed to leave a connected track.
TPC Event Categories 3 Many Extra EL pixels in Region of Interest (ROI) Very rarely (<10-4 per muon stop), there are 8 or more extra EL pixels. Most (~90%) point to the stop position. A gap (circled) of 2 or more pixels separates these from the EH-containing island. Z (anode number) Z (anode number) Y (or Drift Time) Y (or Drift Time) These are likely muon-proton scattering events, in which the recoiling proton has enough energy to make an EH pixel, and which can be mistaken for a good muon stop.
TPC Event Categories 4 Many Extra EL pixels in Region of Interest (ROI) Very rarely (<10-4 per muon stop), there are 8 or more extra EL pixels. A few (10%) do not point to the stop position. This is probably pileup undetected by the entrance counters. Z (anode number) Z (anode number) ? Y (or Drift Time) Y (or Drift Time)
TPC Event Categories This histogram shows the number of each of the indicated TPC events.
Fitted Rate vs. Category A higher rate is consistent with these events being muon-proton scatters out of the fiducial volume, some of which capture on high-Z material. This region will be zoomed in the next slide.
Fitted Rate vs. Category (zoom1) This region will be zoomed in the next slide. Selecting tracks with exactly 1 extra EL pixel in the ROI shows a very strong gondola effect.
Fitted Rate vs. Category (zoom2) Rejecting tracks with any extra EL pixels naturally shows the opposite effect than that highlighted in the previous slide. These show no gondola effect. Clearly we must be very careful about rejecting, even implicitly, muon stops based on extra EL pixels in the Region of Interest.
Residuals of Lifetime Fits Fit Function: Ne(t) = A e-lt + B IsTrack IsTrack with 1 extra EL pixel in ROI The decay rate (l) is fixed to that found in the IsTrack fit (left), and A and B are allowed to vary.
Residuals of Lifetime Fits Fit Function: Ne(t) = A e-lt + B Gondola 1 Gondola 5 Gondola 8 These are IsTrack with 1 extra EL pixel in ROI. l is fixed from the fit to all IsTrack events.
Spatial Distribution of Extra EL Pixels Z [mm] Y [mm]
Spatial Distribution of Extra EL Pixels wrt Muon Stop Position The distributions are indexed by the observed decay time of the muon (electron appearance time wrt the muon entrance time). 0 < TDecay < 1 ms 3 < TDecay < 4 ms 5 < TDecay < 6 ms Zextra EL pixel – Zmuon stop Yextra EL pixel – Ymuon stop 7 < TDecay < 8 ms 9 < TDecay < 10 ms The center of the EL distibution either moves higher in the TPC with time, or the extra EL pixels are associated with the electron. Zextra EL pixel – Zmuon stop Yextra EL pixel – Ymuon stop
Spatial Distribution of Extra EL Pixels wrt Muon Stop Position The distributions are indexed by the observed decay time of the muon (electron appearance time wrt the muon entrance time.
Spatial Distribution of Extra EL Pixels wrt Muon Stop Position The distributions are indexed by the gondola number of an electron (e-Detector track), 0 < tDecay < 1 ms. Gondola 1 Gondola 3 Gondola 5 Zextra EL pixel – Zmuon stop Yextra EL pixel – Ymuon stop Gondola 7 Gondola 9 These appear to be consistent with the hypothesis that the electrons occasionally cause an EL pixel somewhere along their respective paths. Zextra EL pixel – Zmuon stop Yextra EL pixel – Ymuon stop
Lifetime Fits with New and Old Stop Definitions Old stop definition Prod50 m- data. Fit range: 0.1 to 19.5 ms
Lifetime Fits vs. Run Group Variation of rate across different run groups vs. gondola. For each gondola, a constant is fit to the rates across different run groups. Chisquare/NDF is plotted here. Rate vs. Gondola. Data are divided into different groups of consecutive runs. Chisq of constant fit of rate vs. gondola for each run group:Group 1: chisq/ndf = 0.887369Group 2: chisq/ndf = 0.623138Group 3: chisq/ndf = 1.292773Group 4: chisq/ndf = 0.488147Group 5: chisq/ndf = 0.964047 Prod50 m- data. Fit range: 0.1 to 19.5 ms
Lifetime Fits vs. e-Track Definition Prod50 m- data. Fit range: 0.1 to 19.5 ms
Gondola Effect vs. Fit Tstart Prod50 m- data. Tstop = 20 ms
Gondola Effect vs. Fit Tstop Prod50 m- data. Tstart = 0.1 ms
Rate vs. Gondola for Different Targets There is a strong variation with gondola number in the NaturalH2 data. This seems to be due to differences in the amount of scattering that each gondola sees, which effective gives a different impact parameter cut (next slide).
Impact Parameter for Different Gondolas The increased scattering in certain gondolas, especially 6 and 11 (not shown), leads to a much wider impact parameter distribution. Tom’s fast MC (with deuterium diffusion + scattering) has reproduced the strong pull on the rates for these gondolas.
Impurity Capture Yield vs. Y for Different Targets Natural H2 Fill Protium (Prod50) Fill CalibD2 Fill CalibN2