Download
1 / 24
260 likes | 410 Views
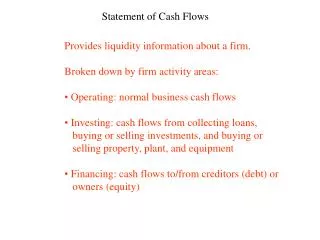
Session 19 Cash Flows & Financial Statement Analysis. Businesses are like Fruit Trees. Fruit = Operating Activities. Trunk & Branches = Investing Activities. Roots = Financing Activities. Statement of Cash Flows. Operating Working capital, day-to-day transactions

E N D
Session 19Cash Flows & Financial Statement Analysis FINANCIAL ACCOUNTING - BUS 020 - FALL 2013 Slide17-3
Businesses are like Fruit Trees Fruit = Operating Activities Trunk & Branches = Investing Activities Roots = Financing Activities FINANCIAL ACCOUNTING - BUS 020 - FALL 2013 Slide17-3
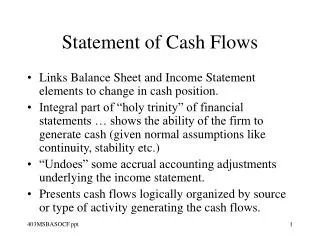
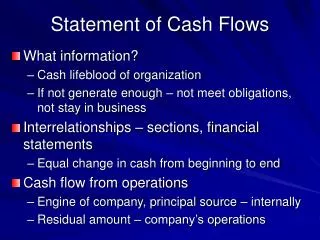
Statement of Cash Flows • Operating • Working capital, day-to-day transactions • Direct versus indirect methods • Investing • Non-current assets—mainly PP&E and marketable securities • Financing • Debt, equity and dividends paid FINANCIAL ACCOUNTING - BUS 020 - FALL 2013 Slide17-3
Target Your Efforts • Solvency assurance • Wealth enhancement • Performance improvement FINANCIAL ACCOUNTING - BUS 020 - FALL 2013 Slide17-3
Start with the 3 P’s • Planning • Processing • Presenting FINANCIAL ACCOUNTING - BUS 020 - FALL 2013 Slide17-3
Include the Trifecta: Q-S-T • Q: Quantitative analysis • S: Strategic assessment • T: Tactical feasibility FINANCIAL ACCOUNTING - BUS 020 - FALL 2013 Slide17-3
Tools for Financial Statement Analysis • Ratio analysis • Trend analysis • Common-size analysis • Base period analysis • Comparative analysis • Horizontal and vertical analyses FINANCIAL ACCOUNTING - BUS 020 - FALL 2013 Slide17-3
A Financial Statement Approach • Look for key relationships • Focus on spending drivers • Don’t overlook the Statement of Cash Flows • Remember to measure trends • Tell a story FINANCIAL ACCOUNTING - BUS 020 - FALL 2013 Slide17-3
Guidelines for a Presentation • Clarity • Accuracy • Simplicity • Visually friendly • Limit page content FINANCIAL ACCOUNTING - BUS 020 - FALL 2013 Slide17-3
Cash Flow Red-Flags • Receivable and inventory growth rate exceeds sales growth rate • Payables growth rate exceeds inventory growth rate • Current liabilities grow faster than sales • Sustained operating losses (negative net income) FINANCIAL ACCOUNTING - BUS 020 - FALL 2013 Slide17-3
Cash Flow Red-Flags (cont’d) • Negative operating cash flow • Capital expenditures exceed operating cash flow • Sustained capital expenditures reductions • Sustained sales of marketable securities in excess of purchases • Substantial shift from long to short term borrowing • Dividend reduction or elimination FINANCIAL ACCOUNTING - BUS 020 - FALL 2013 Slide17-3
Cash Sufficiency Ratio • Cash Flow From Operations + Interest + TaxesPPE + Debt Servicing + Taxes + Dividends • Should be greater than 1 • Can easily disaggregate • Different footprints for different development stages FINANCIAL ACCOUNTING - BUS 020 - FALL 2013 Slide17-3
Cash Conversion Cycle • Cash conversion cycle • Days in payables ≥ DSO + Days in inventory FINANCIAL ACCOUNTING - BUS 020 - FALL 2013 Slide17-3
Typical Common Ratios • Solvency & liquidity • Earnings • Performance FINANCIAL ACCOUNTING - BUS 020 - FALL 2013 Slide17-3
Ratio Analysis • General guidelines: • Be consistent • Ascertain contents of numerator and denominator • Apply common sense… FINANCIAL ACCOUNTING - BUS 020 - FALL 2013 Slide17-3
Trend Analysis • Static analysis is virtually useless • Trend direction is key • Combine with other approaches FINANCIAL ACCOUNTING - BUS 020 - FALL 2013 Slide17-3
Common-size Analysis • Helpful for size discrepancies • Keyed to sales or total assets • Helpful for industry comparisons FINANCIAL ACCOUNTING - BUS 020 - FALL 2013 Slide17-3
Base Period Analysis • Combines trending and percentage analysis • Select representative base year and set the index at 100 • Measure subsequent periods in terms of the base year • Helpful for industry comparisons • Eliminates size bias FINANCIAL ACCOUNTING - BUS 020 - FALL 2013 Slide17-3
Comparative Analysis Cautions • Timing variances • GAAP variances • Conservative vs. Aggressive GAAP • Management attitude…”win at all cost!” • Size • Geographic venues FINANCIAL ACCOUNTING - BUS 020 - FALL 2013 Slide17-3
Horizontal and Vertical Analysis • The most basic…and most powerful analytical tool • Key element in fraud detection • Keeps the organization under control FINANCIAL ACCOUNTING - BUS 020 - FALL 2013 Slide17-3
Horizontal Analysis • Period versus period changes • Value changes • Percentage changes • Look for irregularities FINANCIAL ACCOUNTING - BUS 020 - FALL 2013 Slide17-3
Horizontal Analysis - Example FINANCIAL ACCOUNTING - BUS 020 - FALL 2013 Slide17-3
Vertical Analysis • Relationships within the same period: • Numerical relationships • Percentage relationships • Look for irregularities FINANCIAL ACCOUNTING - BUS 020 - FALL 2013 Slide17-3
Vertical Analysis - Example FINANCIAL ACCOUNTING - BUS 020 - FALL 2013 Slide17-3