Download
1 / 19
190 likes | 278 Views
Statement of Cash Flows. What information? Cash lifeblood of organization If not generate enough – not meet obligations, not stay in business Interrelationships – sections, financial statements Equal change in cash from beginning to end Cash flow from operations

E N D
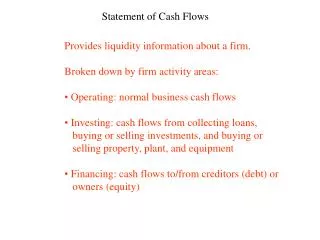
Statement of Cash Flows • What information? • Cash lifeblood of organization • If not generate enough – not meet obligations, not stay in business • Interrelationships – sections, financial statements • Equal change in cash from beginning to end • Cash flow from operations • Engine of company, principal source – internally • Residual amount – company’s operations
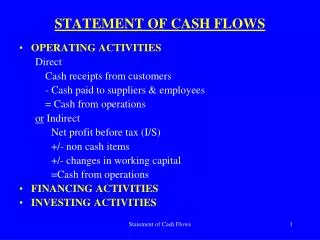
Statement of Cash Flows • Cash flow from investments • Long term and investment assets • Purchase and sale of assets not held for resale • Making and collecting of loans to others • Cash flow from financing activities • Capital structure • Stock, loans, dividends paid
Indirect Method • Determining cash flows • Net income + noncash expenses – increase in current asset + decrease in current asset + increase in current liability – decrease in current liability • Examples • NI - $30,000 • Depreciation - $2,600 • A/R – BI-$1,000, EI-$1,350 • A/P – BI-$1,250, EI-$1,800 • Inventory – BI-$6,000, EI-$5,000 • Salaries Payable – BI-$1,250, EI-$750
Liquidity Ratios • Ratios – analyze financial statements • Lenders, creditors, investors, employees, regulatory agencies • Comparisons - Industry norms, prior period, competitor, planned and budgeted amounts • Describe the financial condition – organization • Efficiency of activities • Comparable profitability • Perception of investors – financial markets • Where come from, current condition, possible future • Indiscriminate use – dangerous – not always indicative – difference in accounting classifications, deliberate manipulation
Liquidity Ratios • If only use ratios – erroneous conclusions • Current ratio – relationship – inflows of cash and demands for cash payments • Quick ratio (acid test) – absolute liquidity – eliminate current assets that cannot be liquidated quickly • Working capital – dollar amount • Operating cycle - number of days from cash to inventory to accounts receivable to cash • Days in inventory + Days in A/R – Days in A/P • reveals how long cash is tied up in receivables and inventory, i.e. Efficiency ratios
Liquidity Ratios • Defensive interval ratio – number of days cash on hand before running out- burn rate divided into cash • how long a company can operate using only current liquid assets • indicates how long a business can operate on its liquid assets without needing further revenues • Defensive Interval Period = (cash + marketable securities + accounts receivable) / average daily purchases
Analysis framework • Business strategy/goals – qualitative • Step 1 – goals, strategies, operating characteristics • Step 2 – outlook for firm sales – goals, markets • Step 3 – investments to support the Product-Market Strategies – investments in A/R, inventories, P & E, acquisitions • Step 4 – future profitability and competitive performance – strong profitability over long run? – influences debt to equity, common stock issuance • Step 5 – future external financing needs • Step 6 – Access to target sources of external finance – established policies
Step 7 – viability of the 3-5 year plan – goals, strategies, investment requirements, financing needs • Step 8 – current year financing plan – need • Step 9 – stress test under scenarios of adversity • Reliable? – annual report? • Profit drivers? - underlying issues that directly determine your company's financial performance • four major profit drivers: 1) price, 2) variable costs, 3) fixed costs (or overhead), and 4) sales volume • Risks? - Some of the risks that almost all businesses face involve competition, price changes, style changes, competition from new products, and changes from fluctuating economic conditions
SWOT – strategic planning tool - Strengths, Weaknesses, Opportunities, and Threats • Competitive advantages/disadvantages • Accounting analysis • Conservative/aggressive choices – anticipate no profit and provide for all losses • Disclosure level • Measurement quality - measured objectively • Audit quality – systematic examination – fairness of financial statements is evaluated • One time events – significant effect
Financial analysis • Ratios – comparison to competition and industry • Value firm against market value of firm • Comparable • Discounted present value of future profits • Multiple of earnings • Cash flow analysis • Classifications • Prospective – forward looking information • Industry – future? • Firm grow with industry? Shrink? Increase market share of industry? • Trend? • Value firm against market value
Financial Ratios and Financial Analysis • Profitability ratios • Return on sales – pg. 9 • Return on equity – pg. 10 • Gross margin % • Activity ratios • ROA – pg. 11 • Days Receivable • Days Inventory • Days Payable • Leverage ratio • Debt to assets – pg. 12 • Debt to equity • Interest coverage – pg. 13 • Liquidity ratios • Current ratio – pg. 14 • Quick ratio – pg. 14
Report/Presentation • Annual Report Project • three distinct parts • Company analysis written report • Using the annual reports from the company website or 10-K reports from EDGAR, you should compare, contrast, and analyze the following aspects of the company, both the company’s trends and how well it is doing against its industry statistics • Profitability • Activity • Solvency • Liquidity • Cash Flows • Corporate Governance • Strategy
Conclusions • How is the company doing in each of the categories from above? • In which areas is the company doing particularly well or improving significantly? • In which areas could the company improve? Be specific about what they could do. • How is the company doing in relation to the industry averages? • What is your overall assessment of the company’s operations and outlook?
Presentation • 20-25 minutes – could be questions at end • Each person in the group must participate in the presentation • The grade is individual so if someone in your group freezes during the presentation, the other students’ grades will not be affected. • Peer Review
Read The Statement of Cash Flows, • Read Assessing a Firm's Future Financial Health, • Assign #9 - Liquidity Ratios for Target - Working Capital, Current Ratio, Quick Ratio years 2005-2007 – 1 paragraph – thoughts, comments - (3/1, 3/4).