Download
1 / 16
160 likes | 314 Views
A Correlation Metric for Cross-Sample Comparisons Using Logit and Probit. KRISTIAN BERNT KARLSON w/ Richard Breen and Anders Holm SFI – The Danish National Centre of Social Research Department of Education , Aarhus University. July 1, 2011 Bamberg ( German Stata User Group Meeting).

E N D
A Correlation Metric for Cross-Sample Comparisons Using Logit and Probit KRISTIAN BERNT KARLSON w/ Richard Breen and Anders Holm SFI – The Danish National Centre of Social Research Department of Education, Aarhus University July 1, 2011 Bamberg (GermanStataUser Group Meeting)
CONTENTS • An issue! • A solution? • An example: Trends in IEO in the US • A conclusion Correlation Metric / K.B. Karlson / Bamberg / July 1, 2011
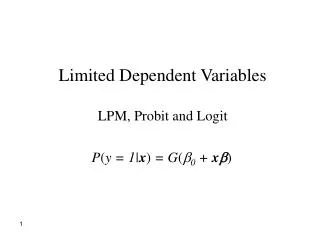
ISSUE: INTERACTION TERMS • Interactioneffects in logit/probit models not identified • Allison (1999): Differences in true effectsconflated by differences in conditionalerrorvariance (i.e., heteroskedasticity) Correlation Metric / K.B. Karlson / Bamberg / July 1, 2011
ISSUE: INTERACTION TERMS • Assume: binary y, manifestation of latent y*. • Following standard econometrics, a logitcoefficientidentifies: • Beta = effect from underlying linear reg. model of y* on x • s = (function of) latent error standard deviation, sd(y*|x) Correlation Metric / K.B. Karlson / Bamberg / July 1, 2011
ISSUE: INTERACTION TERMS • Allisonnoted problem whencomparingeffectsacrossgroups: • Wecannotidentify difference of interest: Correlation Metric / K.B. Karlson / Bamberg / July 1, 2011
SOLUTION: A REINTERPRETATION OF THE LOGIT COEFFICIENT • Interaction terms = identificationissue not easilyresolved! • Wesuggest a new strategy. • Shift of focus from differences in effects (not identified) to • differences in correlations (identified). • = possible solution to problem identified by Allison (1999)in some situations met in real applications Correlation Metric / K.B. Karlson / Bamberg / July 1, 2011
SOLUTION: A REINTERPRETATION OF THE LOGIT COEFFICIENT • We show how to derive, from a logit/probit model, the correlationbetween an observedpredictor, x, and the latent variable, y*, assumed to underlie the binary variable, y: • where b is a logit/probitcoefficient and var(ω)the variance of a standard logistic/normal variable (π2/3 for logit, 1 for probit). Correlation Metric / K.B. Karlson / Bamberg / July 1, 2011
SOLUTION: A REINTERPRETATION OF THE LOGIT COEFFICIENT • It follows that: • Thus: Correlation Metric / K.B. Karlson / Bamberg / July 1, 2011
SOLUTION: A REINTERPRETATION OF THE LOGIT COEFFICIENT • Uses of the correlationmetric for comparisons: • + interestin the relative positions of individuals (or other units • of analysis) within a group, e.g., countries, regions, cohorts. • - interest in the absolute positions of individualswithingroups • - interest in group-differences in effects, but not the within- • group relative positions (e.g., gender, ethnicity). Correlation Metric / K.B. Karlson / Bamberg / July 1, 2011
EXAMPLE: TRENDS IN IEO IN THE US • Thanks to Uli Kohler, -nlcorr-implements the new metric. • EXAMPLE: Did IEO declineacrosscohortsborn in 20th century? • GSS DATA • * Five 10-year birthcohorts, 1920 to 1969.* Outcome: highschool graduation (y=0/1, y* = educ. propensity)* Predictor: Parental SES (papres80) • Corrrelation of interest = corr(SES, y*), over cohorts! Correlation Metric / K.B. Karlson / Bamberg / July 1, 2011
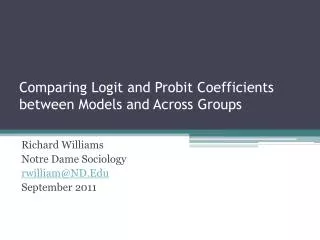
EXAMPLE: TRENDS IN IEO IN THE US • Previous research, argument for usinglogitcoefficients: • ‘differences in [social] background effects … cannot result from changing marginal distributions of either independent or dependent variables because such changes do not affect [the parameter estimates]’ (Mare 1981: 74, parentheses added). • But given our reexpression of the logitcoefficent, differences in logit effects across groups (cohorts) will also reflect differences in sd(x). Correlation Metric / K.B. Karlson / Bamberg / July 1, 2011
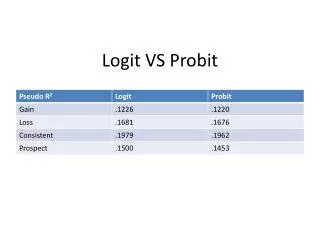
EXAMPLE: TRENDS IN IEO IN THE US • Trends withlogitcoefficients 1920-1929 1930-1939 1940-1949 1950-1959 1960-1969 Correlation Metric / K.B. Karlson / Bamberg / July 1, 2011
EXAMPLE: TRENDS IN IEO IN THE US • Trends withcorrelations Correlation Metric / K.B. Karlson / Bamberg / July 1, 2011
EXAMPLE: TRENDS IN IEO IN THE US • Trends withcorrelations, decomposed Correlation Metric / K.B. Karlson / Bamberg / July 1, 2011
EXAMPLE: TRENDS IN IEO IN THE US • Trends withcorrelations, contrasts, statistical tests Correlation Metric / K.B. Karlson / Bamberg / July 1, 2011
CONCLUSION • Correlationmetric to bepreferred in some situations • -- a solution to the issueidentified by Allison (1999) • Example: Evidenceon trends in IEO differentwhencorrelationmetricused (compared to logitcoefficients). • WP: http://papers.ssrn.com/sol3/papers.cfm?abstract_id=1857431 • A Reinterpretation of Coefficients from Logit, Probit, and Other Non-Linear Probability Models: Consequences for Comparative Sociological Research Correlation Metric / K.B. Karlson / Bamberg / July 1, 2011