Download

1 / 35
350 likes | 509 Views
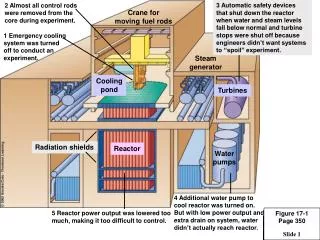
Atmospheric pressure (millibars). Figure 17-2 Page 419. Temperature. Pressure. Mesopause. Stratopause. Tropopause. 0. 200. 400. 600. 800. 1,000. 120. 75. 110. 65. Thermosphere. 100. 90. 55. 80. Heating via ozone. Mesosphere. 45. 70. 60. Altitude (miles).

E N D
Atmospheric pressure (millibars) Figure 17-2Page 419 Temperature Pressure Mesopause Stratopause Tropopause 0 200 400 600 800 1,000 120 75 110 65 Thermosphere 100 90 55 80 Heating via ozone Mesosphere 45 70 60 Altitude (miles) Altitude (kilometers) 35 50 Stratosphere 40 25 30 15 Ozone “layer” 20 Heating from the earth Troposphere 10 5 Pressure = 1,000 millibars at ground level 0 –80 –40 0 40 80 120 (Sea Level) Temperature (˚C)
Figure 17-3Page 420 Photochemical ozone 40 25 35 20 Stratosphere 30 25 Stratospheric ozone 15 Altitude (kilometers) Altitude (miles) 20 10 15 10 5 Troposphere 5 0 0 0 5 10 15 20 Ozone concentration (ppm)
Figure 17-4Page 421 2 – SO4 NO3 – Primary Pollutants CO CO2 Secondary Pollutants SO2 NO NO2 SO3 Most hydrocarbons HNO3 H2SO4 Most suspended particles H2O2 O3 PANs Most and salts Natural Sources Stationary Mobile
Figure 17-5Page 421 March 10, 2000 March 12, 2000 March 15, 2000 March 13, 2000
Figure 17-6Page 424 Solar radiation Ultraviolet radiation NO Nitric oxide O2 Molecular oxygen NO2 Nitrogen dioxide H2O Water O Atomic oxygen Hydrocarbons PANs Peroxyacyl nitrates O3 Ozone Aldehydes (e.g., formaldehyde) HNO3 Nitric acid Photochemical smog
Animation Formation of photochemical smog. Click to view animation.
Figure 17-7 (1)Page 425 40 Nitric oxide Nitrogen dioxide Ozone 30 20 Parts per million 10 0 6 7 8 9 10 11 12 1 2 3 4 5 6 7 8 A.M. Noon P.M. Time
Figure 17-7 (2)Page 425 Smoggy day
Figure 17-7 (3)Page 425 Clear day
Ultra Fine Particles Fine Particles Large Particles Figure 17-8Page 426 Sea salt nuclei Fly ash Carbon black Pollens Paint pigments Tobacco smoke Cement dust Milled flour Combustion nuclei Coal dust Oil smoke Metallurgical dust and fumes Photochemical smog Insecticide dusts 0.001 0.01 2.5 10.0 100.0 Average particle diameter (micrometers or microns)
Figure 17-9 (1)Page 427 Increasing altitude Decreasing temperature Warmer air Inversion layer Cool layer Mountain Mountain Valley
Figure 17-9 (2)Page 427 Descending warm air mass Sea breeze Increasing altitude Decreasing temperature Inversion layer Mountain range
Figure 17-10Page 428 Wind Transformation to sulfuric acid (H2SO4) and nitric acid (HNO3) Windborne ammonia gas and particles of cultivated soil partially neutralize acids and form dry sulfate and nitrate salts Wet acid deposition (droplets of H2SO4 and HNO3 dissolved in rain and snow) Dry acid deposition (sulfur dioxide gas and particles of sulfate and nitrate salts) Sulfur dioxide (SO2) and NO Nitric oxide (NO) Acid fog Farm Ocean Lakes in shallow soil low in limestone become acidic Lakes in deep soil high in limestone are buffered
Animation Acid deposition animation. Click to view animation.
Figure 17-12Page 429 Potential problem areas because of sensitive soils Potential problem areas because of air pollution: emissions leading to acid deposition Current problem areas (including lakes and rivers)
Figure 17-13 (1)Page 430 0 Miles 1,000 0 Kilometers 1,600 China Iran Pakistan Saudi Arabia India Myanmar Arabian Sea Thailand Bay of Bengal Ethiopia Indian Ocean Equator Percentage of direct sunlight intercepted Very heavy 35%–45% Heavy 20%–35% Medium 10%–20%
Figure 17-13 (2)Page 430 Winter Himalayas India Monsoons Cool, dry winds Summer Himalayas India Monsoons Warm, moist winds
Figure 17-14Page 431 Water boatman Whirligig Yellow perch Lake trout Brown trout Salamander (embryonic) Mayfly Smallmouth bass Mussel 6.5 6.0 5.5 5.0 4.5 4.0 3.5 pH
Figure 17-15Page 432 Emission Acid deposition SO2 H2O2 PANs NOX O3 Others Increased Susceptibility to drought, extreme cold, insects, mosses, and disease organisms Direct damage to leaves and bark Reduced photosynthesis and growth Soil acidification Tree death Reduced nutrient and water uptake Leaching of soil nutrients Release of toxic metal icons Root damage Acid
Animation Effect of air pollution in forests animation. Click to view animation.
Figure 17-16Page 433 Prevention Cleanup Reduce air pollution by improving energy efficiency Add lime to neutralize acidified lakes Add phosphate fertilizer to neutralize acidified lakes Reduce coal use Increase natural gas use Increase use of renewable resources Burn low-sulfur coal Remove SO2 particulates, and NOx from smokestack gases Remove Nox from motor vehicular exhaust Tax emissions of SO2
Figure 17-17Page 434 Para-dichlorobenzene Tetrachloroethylene Chloroform 1, 1, 1- Trichloroethane Formaldehyde Benzo-a-pyrene Nitrogen Oxides Styrene Tobacco Smoke Asbestos Radon-222 Methylene Chloride Carbon Monoxide
Figure 17-18Page 436 Outlet vents for furnaces and dryers Open window Open window Openings around pipes Openings around pipes Cracks in wall Cracks in wall Slab joints Wood stove Cracks in floor Clothes dryer Furnace Sump pump Radon-222 gas Uranium-238 Slab Radium-222 Soil
Figure 17-19 (1)Page 437 Nasal cavity Oral cavity Pharynx (throat) (see figure 17.18b) Trachea (windpipe) Bronchus Right lung Bronchioles (see figure 17.18c)
Figure 17-19 (2)Page 437 Epithelial cell Cilia Mucus
Figure 17-19 (3)Page 437 Bronchiole Alveolar sac (sectioned) Alveolar duct Alveoli
Outdoor Exposure Figure 17-21Page 438 Developing countries (urban) 93% Developed countries (urban) 7% Indoor Exposure Total deaths 0.2 million Developing countries (urban) 23% Developing countries (rural) 67% Developed countries (rural) 1% Developed countries (urban) 9% Total deaths 2.8 million
Figure 17-22Page 441 Prevention Dispersion or Cleanup Burn low-sulfur coal Disperse emissions above thermal inversion layer with tall smokestacks Remove sulfur from coal Convert coal to a liquid or gaseous fuel Remove pollutants after combustion Shift to less polluting fuels Tax each unit of pollution produced
Figure 17-23 (1)Page 442 Cleaned gas Electrodes Dust discharge Dirty gas Electrostatic Precipitator
Figure 17-23 (2)Page 442 Bags Cleaned gas Dirty gas Baghouse Filter Dust discharge
Figure 17-23 (3)Page 442 Cleaned gas Dirty gas Cyclone Separator Dust discharge
Figure 17-23 (4)Page 442 Cleaned gas Dirty gas Wet gas Clean water Dirty water Wet Scrubber
Figure 17-24Page 443 Prevention Cleanup Mass transit Emission control devices Bicycles and walking Less polluting engines Less polluting fuels Car exhaust Inspections twice a year Improve fuel efficiency Get older, polluting cars off the road Give buyers tax write- offs for buying low- polluting, energy- efficient vehicles Restrict driving in polluted areas Stricter emission standards
Figure 17-25Page 443 Prevention Cleanup or Dilution Cover ceiling tiles and lining of AC ducts to prevent release of mineral fibers Use adjustable fresh air vents for work spaces Ban smoking or limit it to well- ventilated areas Increase intake of outside air Set stricter formaldehyde emissions standards for carpet, furniture, and building materials Change air more frequently Circulate building’s air through rooftop greenhouses Prevent radon infiltration Use exhaust hoods for stoves and appliances burning natural gas Use office machines in well-ventilated areas Use less polluting substitutes for harmful cleaning agents, paints, and other products Install efficient chimneys for wood-burning stoves