Download
1 / 44
440 likes | 560 Views
Teacher Information. A huge thanks to Carrollton Farmers Branch teachers for creating and sharing this EOC review.

E N D
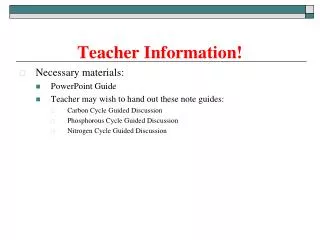
Teacher Information A huge thanks to Carrollton Farmers Branch teachers for creating and sharing this EOC review. FISD Geography Teachers – I have taken a review that CFB created and using their pictures and resources put it into a PowerPoint for you to use with your students. I have also included in the notes section some of their instructions to help you. You will see these listed as Teacher Script. Materials Needed: Tape, Glue sticks, and map colors Student Map – The map is in a Publisher File and will automatically print the world map on 6 different sheets of paper. Students will have to tape the maps together. (This may take about 20 minutes or so for 9th graders). Student Packet – each student will need the student resource packet – since these items will be cut up, it is essential that you run the packets on only one side of the paper. Suggestion: Since not all of the cutting and gluing will happen on the same day – you might want to give the students a manila folder to hold their remaining items. Student quizzes Power Point Atlases or textbooks
World Geography EOC Review Below is an example of what your map will look like when we are complete.
Your Map will include items on the back … We will process significant information on the back of your map.
Physical Features • You will begin to fill out physical features on each continent according to the physical features page of the resource packet. Students may need access to an atlas or textbook • Glue key to top left corner of their map
Population • What do population pyramids tell us?
Population Pyramids 1. Cut out the population pyramids from your student packet and glue them on or near the appropriate country. You will have 10 of them. 2. Cut out the blocks of people and glue them in or near two highly populated countries. 3. Cut out the growth images and glue them on or near two fast growing countries.
Exit slip • How can we address problems facing fast growing populations? • What are the challenges facing shrinking populations? • What are the population issues your region faces? • How can they be addressed?
Culture – Draw a red heart on your map for each of the culture hearths on the map below. Can you identify why each of these is a cultural hearth? Think history…..
Religion – where did it start and where has it spread? Complete the religion chart and glue it on the back of your map….
Use the symbols you created in your religion chart to mark the location of each religion on your map.
Language – cut the key to the left from your student packet and glue it under your physical key on your map and label languages on your map using this key.
Migration - complete the push/pull chart below in your resource packet. Glue the chart to the back of your map as directed by your teacher.
Using the migration map below – draw arrows on your map to show the migration routes. Why did each of these migrations occur?
Net migrations – Why do these different regions fall into these different categories?
Economics Cut out the four pictures below and glue them next to the correct economic activity on the chart. Using what you know about economic activities, determine which level of development is most likely to have this activity (more developed, newly industrialized, or less developed). Glue the completed chart onto the back of your map as directed by your teacher.
Economics…. On your economics chart like the one below, write a definition for each form of economy. Determine an example for each form of economy. Glue the chart onto the back of your map as directed by your teacher.
Government Cut out the pictures below and glue them next to the corresponding form of government on the chart. Glue the chart on the back of your map.
Resources, Climate, Weather List what you know about each climate region in the chart below. Cut out the chart and glue it to the back of your map.
How does climate affect how people live? Simple summary of climatic zones: Polar - very cold and dry all yearTemperate - cold winters and mild summersArid - dry, hot all yearTropical - hot and wet all yearMediterranean - mild winters, dry hot summersMountains (tundra) very cold all year The classification is based on maximum and minimum temperatures and the temperature range as well as the total and seasonal distribution of precipitation.
Weather 1. Complete your chart using your knowledge and classroom resources. 2. Using the symbols you created, draw the symbols on the front of your own map in the appropriate places for each phenomena. 3. Cut out the chart and glue it to the back of your map.
Resources Oil Coal Lumber Diamonds/ gemstones Nuclear Power Cut out these images. Using classroom resources, look up the main locations for these resources and glue them in the proper regions on your world map.
Resources, Climate, Weather Exit Slip: How does the location of resources determine the development level of a nation?
Conflicts • Cut out the “caution” symbols and glue them onto the following sites on your map to represent these areas of conflict. • Ireland • Bosnia • Israel • Rwanda • Sudan • South Africa • Chechnya • Uganda • North Korea
Conflicts continued…. • Determine which kinds of conflict apply to the countries using the boxes provided. • Cut out each box and glue them on the back of your map.
Conflicts continued…. • Cut out and glue the visuals into each conflict box that best fits. Make sure there are two pictures per conflict. • Cut out each conflict box and glue it to the back of your map as directed by your teacher.
Conflict Exit Slip… How is conflict seen through the eyes of differing cultures?
Development Profiles • The task: Create a poster that symbolizes the characteristics of your assigned level of development. Be sure to include a world map that indicates the regions of the world that fit your assigned level of development. • Have students share out with the class. • Exit slip: What are the similarities and differences between levels of development?
Regional Profiles • The task: Create large map of the region you were assigned. Add symbols, pictures, and words to the map so that it reflects the many facets of the region. • Have students share out with the class
Patterns • The task: Student will create a presentation that explains how their assigned top applies to the world. • The presentation can be in any format you choose. (i.e. students might create a rap describing how imperialism has impacted the different regions of the world)