Download
1 / 29
290 likes | 434 Views
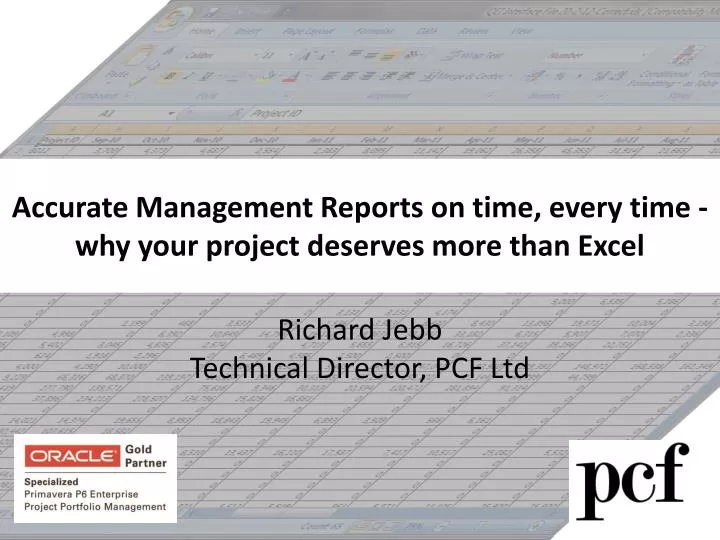
A ccurate Management Reports on time, every time - why your project deserves more than Excel. Richard Jebb Technical Director, PCF Ltd. Contents. Introduction to PCF The Challenge of Project Reporting Spreadsheets – the “obvious” solution Errors and Risks QEI Management Reporting

E N D
Accurate Management Reports on time, every time - why your project deserves more than Excel Richard JebbTechnical Director, PCF Ltd
Contents • Introduction to PCF • The Challenge of Project Reporting • Spreadsheets – the “obvious” solution • Errors and Risks • QEI Management Reporting • Example Reports and Case Studies
Introduction to PCF • Founded in 1982 • Based in Hemel Hempstead • Specialists in graphical reporting for projects • Customers include:
The Challenge of Project Reporting • Your organisation/customer has a standard set of reports in a predefined format • Your project management tools cannot produce them • Data comes from multiple sources • Need to create specific charts/graphics • There is acute time pressure to deliver
Why Choose a Spreadsheet? • Familiarity – available on every desktop • Easy to import/paste in data • Built in charting and graphics functions • Bypasses the IT department
Is This Wise? • With Excel on every desktop, on the surface it would seem like anyone can build a spreadsheet. And yet just because someone knows how to use Word, we don’t automatically assume they are a good writer. • The task of developing the spreadsheet often goes to the person with the most relevant domain knowledge, rather than coding expertise
Error Rates • Large body of research now exists • Over 80% of all spreadsheets contain errors • Typical cell error rate (CER) is roughly 1% • Inspection of spreadsheets by experienced users picks up roughly 50% of errors • The structure of spreadsheets makes it easy to create errors, and hard to identify them • References: • http://www.strategy-at-risk.com/2009/03/03/the-risk-of-spreadsheet-errors/ • A Critical Review of the Literature on Spreadsheet Errors Powell et al. , Tuck School of Business 2008 • Errors in Operational Spreadsheets Powell et al. , Tuck School of Business 2009
Error Cascades Wrong Result: CER = 0.87% Poor Practice: CER = 1.79%
Spreadsheet Risks • Easy to mix data and logic - makes debugging difficult • Often created by staff with no formal programming training • Model may never have been validated with test case data • Logic within model (or how to use the model itself) may not be documented • No control on integrity of data once extracted from source(s) • Spreadsheet is often "owned" by an individual, rather than the organisation
Other Issues • Data is dead – just numbers, with no associated structure • Transferring/formatting data at each period end can take a long time • Need to decide reporting time unit in advance for time scaled data (eg weeks, months)
Things to Consider • Was a requirements document ever issued? • Where did the model come from (e.g. written for this project, copied from another project, downloaded from the web?) • Has the model ever been formally tested? • Is there any documentation? • What risk assessment has been performed – what would be the consequence of • Delivering incorrect results? • The “owner” moving elsewhere?
What are the Alternatives? • CAD System ? • Visio ? • Write your own ? • ...or QEI Management Reporting
Standard Views Structure (eg WBS) PERT network Gantt Chart Resource histogram Calendar Earned Value Tables Custom Views Time Chainage BoxCharts DrillDown User Defined User Interaction QEI Environment Database Vector/Raster Graphics maps plans symbols Published Data views/tables resource loads entire database HP-GL, DXF JPEG, BMP, GIF, … views clipboard, HTML, JPG, EMF, SVG, XML links Model Data tasks breakdown structures resources logic work patterns MPX, ASCII, CSV, DBF, ODBC model 3rd Party Application Application standard processes custom processes data data QEI Product Architecture
How Does It Work? • Data is imported via a wizard to create a snapshot model of the live project • Multiple projects can be imported into a single QEI database • Reports are built as graphical views linked to the data model • Allows data from multiple sources to be combined into single set of reports
What Data Is Stored? • WBS, Tasks and Logic • Calendars • Resources • Cost Rates • Baseline Data It is also possible to create alternate breakdown structures for reporting purposes
Resources • Values can be displayed as quantities or costs • Values can be calculated for any single resource, a group of resources, or all resources • Curves can be computed for any point in any breakdown structure • Costs can be calculated from multiple time varying sets of rate data • Time varying availability values can be displayed
Key Benefits • Process can be automated via macros • PMO retains control of reporting • Data model allows for “what if” modelling: • Schedule slippage • Varying resource availabilities • Varying resource rates • Allows integration of data from multiple sources into a single entity
Example 1 (Defence Contractor) • 35,000 tasks spread over 600 projects and 200 departments • Monthly 250 page report pack took PMO 3 days to prepare • Use of QEI reduced report production time by 80% and introduced EV graphics for all projects
Example 2 (Aircraft Manufacturer) • Used QEI to visualise aircraft build configuration, generate per-shift activity charts and assess impact of new orders on capacity • Customer quotes: • "for the first time we are able to fully visualise what our staff are achieving on a shift by shift basis" • "once we had built the QEI model we could adjust the sequence of operations, significantly improving our assembly times - in some cases by up to 60%"
Example 3 (Water Company JV) • 140 projects, £250m total budget • Budgets, progessand actuals were all originally in separate Excel spreadsheets used to record subcontractor data • Unable to determine programme performance or generate timely reports • EV and performancereports created in QEI direct from single spreadsheet – full period end import takes approximately 15 minutes
Example 4 (International Airline) • Significant percentage of fleet approaching 10 year overhaul, each aircraft out of service for a month plus labour costs of £1m+ • Existing inhouse systems unable to predict when these checks would fall due • QEI was used to predict dates/costs of work based on flying patterns and various maintenance scenarios, to identify most cost-effective solution
Thank You • If you are interested in learning more about QEI Management Reporting please call us on +44 1442 355100, or check out our website at http://www.pcfltd.co.uk
References • Google for "prevalence of errors in excel spreadsheets" • http://www.burns-stat.com/pages/Tutor/spreadsheet_addiction.html • http://www.eusprig.org/horror-stories.htm • http://www.f1f9.com/the-problem • http://www.strategy-at-risk.com/2009/03/03/the-risk-of-spreadsheet-errors/ • http://www.ion.icaew.com/itcounts/23601