Download
1 / 10
100 likes | 257 Views
Excel 在投资理财中的运用. 第 5 小组: 38081115 焦丕坤 38081117 郭德福 38082101 潘 娜 38086120 刘玮健. 求任意日期购买的债券的现值. 例: 假设某面值为 1000 的债券,到期日为 2020 年 1 月 1 日,息票年利率为 8% ,且半年付息一次,利息分别于每年的 1 月 1 日和 7 月 1 日进行支付。若该债券的必要收益率为 7% ,若今日为 2000 年 10 月 25 日,计算今天债券的价格应为多少?.

E N D
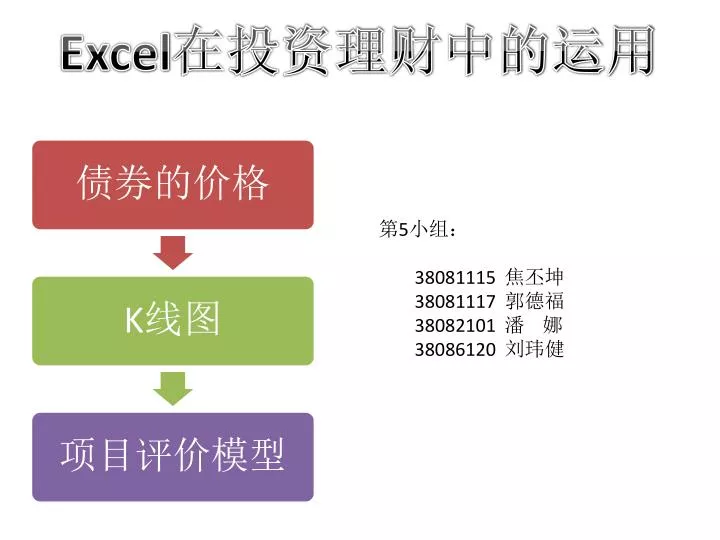
Excel在投资理财中的运用 第5小组: 38081115 焦丕坤 38081117 郭德福 38082101 潘 娜 38086120 刘玮健
求任意日期购买的债券的现值 例:假设某面值为1000的债券,到期日为2020年1月1日,息票年利率为8%,且半年付息一次,利息分别于每年的1月1日和7月1日进行支付。若该债券的必要收益率为7%,若今日为2000年10月25日,计算今天债券的价格应为多少?
注意:此处应输入序列数,使用date函数 财务函数PRICE 注意:此处必须是100,因为PRICE是按照票面值是100的债券设计的。
结论及扩展: • 题目中的债券面值为1000,所以用PRICE算出结果以后,应该乘以10; • 使用YLD(必要收益率)函数时,参数内容和PRICE相同,需注意的地方也一样; • 自制序列数,使PRICE函数更智能: 这样就可以对交割日期使用微调项,使函数看起来像一个计算器。
K 线 图 选中数据源,点插入其他图标股价图
选中坐标轴,右键,点击“设置坐标轴格式”,出现右图选中坐标轴,右键,点击“设置坐标轴格式”,出现右图 左纵轴: 最大值改为30000 右纵轴: 最大值改为100 最小值改为30 横轴: 改坐标轴类型为文本坐标轴
项目评价模型 可以使用微调项 MAX ﹜ 对三年的回报用NPV函数求得现值,在加上初始投资(负数),得出项目的净现值。 注:负表示投资,正数表示回报 INDEX MATCH 找出序数对应的项目 找出最大净现值匹配的序数