Download
1 / 48
480 likes | 556 Views
Anthony R. Lupo Department of Soil, Environmental, and Atmospheric Science. Interannual and Interdecadal variations in temperature and Precipitation in the Missouri Region.

E N D
Anthony R. Lupo Department of Soil, Environmental, and Atmospheric Science Interannual and Interdecadal variations in temperature and Precipitation in the Missouri Region
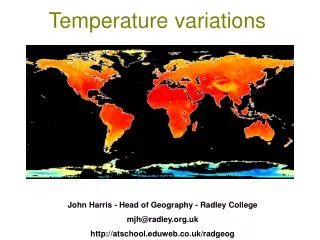
Temperature and precipitation in Missouri vary strongly on a time-scale of 2 – 8 years, and this variability is dominated by El Niño and Southern Oscillation. (ENSO) The impact of ENSO is very complicated in Missouri because of the typical path of the jet stream. Introduction
The ENSO response in Missouri is stronger during the winter than during the summer. The ENSO response is then modulated on the decadal time-frame by a phenomenon called the Pacific Decadal Oscillation (PDO). Introduction
Path of the Jet Stream during each phase of ENSO (ENSO – F, PDO1) Introduction
In order to make successful seasonal forecasts, one must understand interannual variability as well as a phenomenon we call “blocking”. • “Blocking” is a persistent ridging in the East Pacific Region, as well as other oceanic regions, but this region exerts a strong influence on our weather. Motivation
The impact of El Niño. El Niño, what is it? El Niño –means literally “the child”, in this case, THE Child as El Niño typically sets in around Christmas on the coast of South America! ENSO, what is it?
El Niño (or ENSO – El Niño and Southern Oscillation) is the generic term referring to the see-saw of warm (El Niño) and cold (La Niña) sea surface temperature patterns in the eastern Tropical Pacific This occurs every 2 – 7 years! ENSO, What is it?
The El Niño cycle has been known for some time by the scientific community (e.g., Sir Gilbert Walker), and impacts the global weather beyond the tropical Pacific. ENSO, What is it?
Currently: (ENSO-neutral) (Source: Climate Prediction Center) http://www.cpc.ncep.noaa.gov/products/analysis_monitoring/ensostuff/ ENSO, What is it?
Forecasts are projecting La Niña conditions to develop during the late summer and into fall. ENSO, What is it?
Ratley (Ratley, Baxter, Lupo) et al. 2002 discussed the onset of the summer regime in the mid-west and it’s relation to ENSO. They noticed that before the summer regime becomes “established”, significant rains (widespread and more than 0.25 inches) fall on average every 7 days. This becomes every 12 days after the onset of the summer pattern. ENSO, What is it?
They then found that in summers involving the transition into a (future) El Nino situation, the mean precipitation frequency in spring and summer is 6 days and 10 days, respectively. (e.g., summer 1993, summer 2004) • For the transition into a La Nina situation, the corresponding numbers are 8 days, and 19 days, respectively. (e.g., summer 1983, 1988, 1999, 2005, and historically, the severe dry spell of the 1950’s) ENSO, What is it?
Thus, they found that in the Missouri region, there is not a significant difference region-wide in precipitation amounts year-to-year, but the frequency of heavy precipitation is markedly different. It is well-known in the agricultural community that lighter, more frequent (regular) precipitation events are much better for crops. ENSO, What is it?
The results of Ratley et al. (2002) are based on 30 years worth of data. We’re currently working on extending this analysis back to 1900. Initial results from this extended work (future Birk and Lupo paper) support the results given here. ENSO, What is it?
Lupo et al. (2007,2008) studied the monthly global SST and 500 hPa height charts was shown to be a reliable method for classifying the SST anomaly distributions into one of seven different synoptic categories (A – G) Kung and Chern (1995). • To confirm reliability, visual inspections of two years worth of monthly mean SST anomalies for randomly chosen months within the Kung and Chern study were carried out. ENSO AND SST Analysis
All months inspected by our group matched those of the Kung and Chern (1995), who also used manual inspection after establishing their set of seven distinct anomaly types. • Methodologies in which manual analysis can be done quickly and easily would be useful in an operational forecasting environment. ENSO and SST Analysis
The “magnificent seven”: ENSO AND SST Analysis
SST clusters B and G are representative of La Niña type clusters in the Pacific Ocean basin. These are also characteristic of SST anomaly distributions in the Atlantic Ocean Basin which are the opposite of each other. Clusters A and E are characteristic of ENSO Neutral type conditions, including a fairly weak signal in the topics and a stronger mid-latitude signal. These SST anomaly distributions are similar in each major ocean basin, with the exception that E-type anomalies are associated with a more widespread coverage of warm anomalies in general. ENSO and SST Analysis
The remaining clusters are C, D, and F type anomalies, which are representative of El Niño-type SST distributions in the Pacific Ocean basin. The D-type cluster represents fairly weak ENSO conditions, with the main SST anomaly located closer to the east-central Tropical Pacific. • The C and F type anomalies represent stronger El Niño conditions, with the warm SST anomalies located in the far eastern Tropical Pacific Ocean (Clarke and Li (1995)). • C and F type anomalies are also similar to each other with the exception that F type anomalies are associated with more widespread coverage of warm anomalies especially in the North Pacific and Atlantic Ocean basins. The C-type anomalies are characterized also by a strong warm SST anomaly oriented along the equator. ENSO and SST Analysis
What the data showed were that from 1955 – 1976, A, B, and D anomalies were dominant. • From 1977 – 1998, E and F anomalies were dominant. • Since 1999, we’re back to A,B, D, and G’s. ENSO AND SST Analysis
These break points correspond very well to the change in phase of the PDO. Thus, we have circumstantial evidence that the SST type corresponds not only to interannual variability, but to interdecadal as well. PDO and SST Analysis
The PDO (courtesy of Joint Institute for the Study of Atmosphere and Ocean, University of Washington) • Negative Positive PDO AND SST Analysis
PDO Index (courtesy of JISAO, Univ of Washington) PDO AND SST Analysis
The impact of PDO is to modulate the ENSO cycle, that is during the cool phase of PDO, the ENSO impact is weaker in MO. During the warm phase of the PDO, the ENSO cycle is enhanced. PDO AND SST ANALYSIS
Study Region (Birk et al. - 2010) (data gathered from 1900 – 2005 – where possible) INTERANNAUL TEMPERATUrE VARIATIONs
Minneapolis, MN: ENSO variability changes from north to south across our region. ENSO variability stronger in PDO 1 phase (north). Interannual Temperature Variations
Fayetteville, AR: ENSO variability changes from north to south across our region. ENSO variability not stronger in either phase. Interannual Temperature Variations
1977 – 1998 (PDO 1) • Dominated by E and F SST clusters. E-type (mid-latitude SSTs strong) showed little correlation to Missouri region temperatures and precipitation • F-type showed a slight tendency toward dry conditions, and warm in winter, cool in summer. Results: SST versus Local Temperature and Precipitation
1955 – 1976, and 1999 – present (PDO 2) A and B types – little correlation to Mid-Missouri weather and climate. These were also strong in the mid-latitudes. D-type: warmer (at the 95% confidence level) and drier (at the 99% confidence level) – especially outside the cold season. Results: SST versus Local Temperature and Precipitation
G type: warmer and wetter (significant at the 95% confidence level), especially during the cool season. • In warm season, cool and dry. Results: SST versus Local Temperature and Precipitation
C-type clusters: Sample size for prolonged C-type (ENSO type) clusters was small, but analyzing these is also more complex as it was the only SST type in which there were nearly equal occurrences of these in both PDO1 and PDO2 years. Behavior of these distributions demonstrates that these distributions were different from normal at the 95% and 99% confidence level for monthly mean temperatures (cooler) and precipitation (wetter), respectively. Results: SST versus Local Temperature and Precipitation
Q: What is blocking? A: It is a large-scale, persistent, nearly stationary, mid-latitude, dynamically driven ridging in the jet-stream. The dynamics of blocking are not completely understood, even though the climatological behavior is well-understood (see Lupo and Smith, 1995a,b, Tellus; Weidenmann et al.m 2002, J. Climate; Burkhardt and Lupo, 2005, J. of Atms. Sci.) Blocking and influence on the Midwest
Blocking unusual in August, and when they occur in the Alaska region, they force cooler air into North America. This event was unusual because prolonged blocking usually CAUSES drought, e.g., Europe 2003, or Alaska, 2004! Blocking and influence on the Midwest
Blocking is one of the keys to understanding seasonal variations in the weather, both observed and for predictive purposes. (El Nino is the other, more later) • This is well-known in the climatological community during the winter, but we sometimes forget about summer season blocking. Blocking and influence on the Midwest
Summer 2005 - a year to confound climatologists in the future! Why? The summer precipitation across the region was actually above normal! Blocking and influence on the Midwest
Summer precipitation was at 15.3” in mid-Missouri, normal is 11.7 inches. But 10” of this occurred during 14 days in August! What was the cause? A rare case of summer blocking! Blocking and influence on the Midwest
The jet stream was pushed southward – by 10 August. Blocking and influence on the Midwest
By August 13, rains were falling across the midwest. Blocking and influence on the Midwest
Summer, 2004 – a study in contrast (blocking was favorable to the mid-west). 2005 2004 Blocking and influence on the Midwest
Temperatures for Summer 2004 – 3rd coolest summer on record for mid-MO and a “top 5” for most of the mid-west and plains. (Source of picture: Midwest Regional Climate Center) Blocking and influence on the Midwest
June 2004 July 2004 August 2004 Blocking and influence on the Midwest
Summer 2004 upper air pattern. Blocking and influence on the Midwest
Summer 2004 versus Summer 2005 (source Missouri Agricultural Statistics service) 2004 2005 Blocking and influence on the Midwest
Soybeans – trend from 1965 – 2005 (source Missouri Agricultural Statistics service) Blocking and influence on the Midwest
Using monthly mean global SST and 500 hPa height data routinely available via the internet or regular monthly publications, as well as the mean temperature and precipitation time series from 1900 – present for stations that are representative of the mid-Mississippi valley, and beyond. • We examined interannual and interdecadal variations in the climate of this region. See Birk et al. (2010), Lupo et al (2005, 2007, 2008), Ratley et al. (2002), Akyuz et al. (2004) - Tornadoes, Berger et al. (2003) – snowfalls. Summary and Conclusions
The results validate the conclusions of Kung and Chern 1995, in that SST clusters B and G (C, D, F) [A and E] are representative of La Niña (El Niño) [neutral] conditions within the Pacific Ocean basin. • In particular, the period 1955-1976 was dominated by SST types A – D, while the period 1977 – 1998 was associated with the occurrence of E, F, and occasionally C modes. • The most recent period (1999 – present) has been dominated by G, A, and B modes. Finally, the most recent months have marked the occurrence of weak El Niño events, which were associated with D-type anomalies. Summary and Conclusions
Only the long-lived D- (G-) type clusters were associated with distributions skewed toward warmer and drier (wetter) conditions, and these were associated with El Niño - (La-Nina) years. during D- (G-) type months the statistical analysis of these two flow regimes was not straightforward, since during these months, the most common occurrence when treating the data as a bivariate population were warm and dry (cool and dry) months Summary and Conclusions
Questions? • Comments? • Criticisms? • Lupoa@missouri.edu • http://weather.missouri.edu/gcc The END!