Download
1 / 41
410 likes | 525 Views
Using Six Sigma Methodology to Improve Travel Request Process in Oklahoma DRS. Lyuda Polyun Statistical Research Specialist, Oklahoma DRS 9/16//2013. What is Six Sigma?. Methodology for continuous improvement.

E N D
Using Six Sigma Methodology to Improve Travel Request Process in Oklahoma DRS Lyuda Polyun Statistical Research Specialist, Oklahoma DRS 9/16//2013
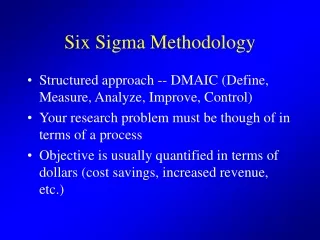
What is Six Sigma? • Methodology for continuous improvement. • Methodology for creating products/ processes that perform at high standards. • Set of statistical and other quality tools arranged in unique way. • Way of knowing where you are and where you could be! • Quality Philosophy and a management technique.
Improvements Based on Data “In God we trust; all others bring data.” - W. Edwards Deming Good decisions are based on Data.
Origins of Six Sigma • 1987 Motorola Develops Six Sigma • Raised Quality Standards • Other Companies Adopt Six Sigma • GE • Promotions, Profit Sharing (Stock Options), etc. directly tied to Six Sigma training • Dow Chemical, DuPont, Honeywell, Whirlpool
Six Sigma and Lean Six Sigma • Six Sigma was designed to specifically focus on process variation. • Lean has a tool set that is geared to improve process flow. • Don’t separate them - combine them.
Using Lean in Government • Creating value for the customer while using the fewest resources possible. Getting the right service in the right amount to the right person at the right time. • A way of thinking to adapt to change, eliminate waste, identify and solve problems, and continuously improve. • The best tool to reduce costs/wastes while also increasing service/capacity. • Do more with less.
Improvement Events Improvements fall into the following categories: • Kaizen events • BPIs – Business Process Improvements • Benchmarking • Just Do Its • Organizational Culture of Improvement
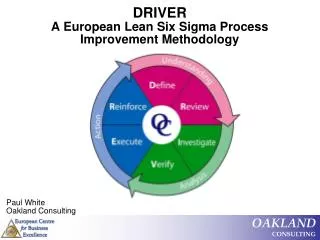
DMAICSix Sigma Improvement Methodology • A logical and structured approach to problem solving and process improvement. • An iterative process (continuous improvement). • A quality tool with focus on change management.
Selecting a Project • Process with the obvious defects. • Process with the capability issues. • Has the potential to result in increased revenue, reduced cost or improved efficiency. • Project should have identifiable process inputs and outputs. • A good Six Sigma project should never have a pre-determined solution. • Has collectable data.
Define – Phase 1 of 5 In this phase, the leaders of the project create a Project Charter, a high-level view of the process, and begin to understand the needs of the customers. • Define the problem by developing a Project Charter. • Define process by developing maps of the process – SIPOC. • Define your customer and their requirements – Voice of the Customer: Customer Survey.
Measure – Phase 2 of 5 Measurement is critical. • Determine how the process currently performs: Value Stream Mapping • Create a plan to collect the data: Data Collection Plan
Data Collection There is very little data on what customers truly need, how they are doing, or what are the problems/issues? • What are the error rates on applications? • Why do we get phone calls? • How long should this process step take? • Are our instructions clear to customers? • What are our sources of complaints? • Etc.
Make Data Collection Simple • Use check lists, frequency plots, and concentration diagrams. • Collect data by the people working with the process – creates engaged staff. • Data drives problem identification which drives problem solving closest to the problem.
Data Collection Plan Defects Measurements Time Measurements
Benchmarking Benchmarking is a way of discovering what is the best performance being achieved in another company, competitor or the industry. • OMES Process • OKDHS Process
Analyze – Phase 3 of 5 What does your data tell you? • Visually inspect the data (Defects measurements) • Closely examine the process Time Analysis Value Added Analysis Value Stream Mapping • Brainstorm potential cause(s) of the problem
Voice of the Customer: Survey Findings • 51% of customers travel 1-4 times per year. • 25% travel 5-11 times per year. • 26.6% combine business travel with personal. • 72% of travelers know their plans in advance of 10 working days or more. • 76% of the respondents indicated that it takes 0-4 hours to complete the booking from start to finish.
Identified Areas Needing Improvements • Changes are made in 57% of requests. • Called for missing invoice in 12% of the cases. • HRD requests constitute 48% of all cases (possibly design a new process for HRD). • 15% of requests are classified as “Other.” • Approval process for HRD requests: supervisors : 12.6h (5h for direct A900s). • VA/NVA analysis revealed that supervisor approvals for HRD requests and collecting hotel invoices are Non Value Added activities the team is spending 15.6h performing.
Improve – Phase 4 of 5 How will you fix the problem? • Brainstorm solutions that might fix the problem. • Develop maps of processes based on different solutions (To-Be Maps). • Select the best solution(s). • Implement the solution(s). • Measure improvement.
Improvements to the Process • Eliminated waste and reduced the travel request cycle time for HRD requests from 5.7 days to 3.6 days. • Numerous changes to the Sharepoint Travel Form and travel resources. • Modified Form. • Created system of accountability for people who consistently abuse rules of the travel process. • Pilot: allow frequent travelers to use agency’s p-card. • Office Improvements. • Event Coordinator Position.
Control – Phase 5 of 5 How do you sustain the new improvement? • Continuously improve the process using Lean principles. • Ensure the process is being managed and monitored properly. • Apply new knowledge to other processes in your organization. • Share and celebrate your success.
Contact Information Lyuda Polyun Statistical Research Specialist, Oklahoma DRS lpolyun@okdrs.gov linkedin.com/in/lyudapolyun