Download
1 / 27
270 likes | 474 Views
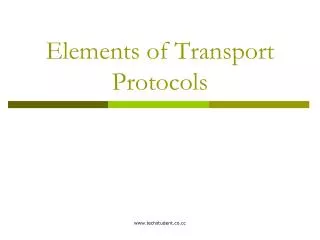
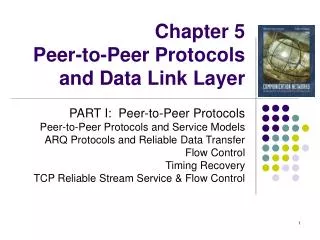
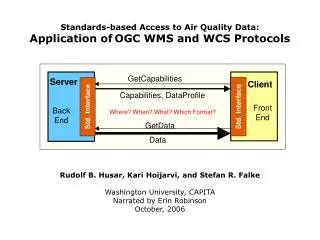
GetCapabilities. Server. Std. Interface. Std. Interface. Client. Capabilities, DataProfile. Front End. Back End. Where? When? What? Which Format?. GetData. Data. Standards-based Access to Air Quality Data: Application of OGC WMS and WCS Protocols.

E N D
GetCapabilities Server Std. Interface Std. Interface Client Capabilities, DataProfile Front End Back End Where? When? What? Which Format? GetData Data Standards-based Access to Air Quality Data:Application ofOGC WMS and WCS Protocols Rudolf B. Husar, Kari Hoijarvi, and Stefan R. Falke Washington University, CAPITA Narrated by Erin Robinson October, 2006
T1 T2 WCS Interoperability Universal Space-Time Data Query in Physical Coordinates Temperature Ozone Bounding Box Time Range Parameter Name Data Coding Geo-reference ISO, OGC Time-code ISO Standard names CF
Slicing of Data-Cubes with WCS Space-Time Queries Abstract Data Model
OGC WCS Demonstration: Grid, Image, Station Data Types Services WCS Query ServicesWCS Query Coverage=THEEDDS.T& BBOX=-126,24,-65,52,0,0 &TIME=2002-07-07/2002-07-07&FORMAT=NetCDF Coverage=SURF.Bext& BBOX=-126,24,-65,52,0,0 &TIME=2002-07-07/2002-07-07&FORMAT=NetCDF-table Coverage=SEAW.Refl& BBOX=-126,24,-65,52,0,0 &TIME=2002-07-07/2002-07-07&FORMAT=GeoTIFF COVERAGE=sst& BBOX=-126,24,-65,52,0,0 &TIME=2001-01-01,2001-01-01&FORMAT=NetCDF Grid Image UNIDATA – THREDDS/GALEON WCS DataFed GALEON WCS Services WCS Query Services WCS Query Station Grid U Florence, It GALEON WCS DataFed GALEON WCS
OGC WCS Demonstration: THREDDS_GFS 4Dim Dataset Map View Services WCS Query Elevation View Services WCS Query Time View Services WCS Query Lat/Lon Box Elev Range Time Range Map: BBOX=-180,-90,180,90, 1350,1350& TIME=2005-12-06/2005-12-06/PT3H Time: BBOX=-34,49.05,-34,49.05, 1350,1350& TIME=2005-12-05/2005-12-08/PT3H Elev: BBOX=-34,49.05,-34,49.05, 0,18000 & TIME=2005-12-06/2005-12-06/PT3H The form of the WCS query is the same for all slices through the data cube (views) The only difference in the views is the thickness of the slices in each dimension Return grid is in multiple formats (NetCDF, CSV, GML, PNG, … )
DataFed WCS Server for Point Observation Data The current version of WCS (1.0) only supports grid and image data types. Coverages can include other representations of space-time varying phenomena, such as observations from an air quality monitoring network. An example WCS query for a point dataset in DataFed is:http://webapps.datafed.net/dvoy_services/ogc.wsfl?SERVICE=wcs&REQUEST=GetCoverage&VERSION=1.0.0&CRS=EPSG:4326&COVERAGE=AIRNOW.pmfine&FORMAT=CSV&BBOX=-125,22,-61,51,0,0&TIME=2005-06-27T15:00:00Z&WIDTH=999&HEIGHT=999&DEPTH=999 &BBOX=-100,22,-100,22,0,0&TIME=2005-06-20T00:00:00Z/2005-06-30T23:00:00Z
Summary Applicable to most data types Station, Image, Grid OGC WCS protocol is suitable for delivering most air quality data: Suitable for most data view queries BBOX, TIME Station-Point SQL Server, Files… SequenceImage, file nDim GridOpenDAPNetCDF, …
Outline • DataFed in a Nutshell • Interoperability for agile, user-driven data systems • Service infusion process, opportunities and impediments • Summary
DataFed in a Nutshell Approach: Mediation Between Users and Data Providers DataFed assumes spontaneous, autonomous data providers Non-intrusively wraps datasets for access by web services Mediates, homogenizes data views. e.g. geo-spatial, time... Applications Browsers and analysis tools for distributed monitoring data Serve as data gateway for user programs; GIS, science tools DataFed is focused on the mediation of air quality data
Data Access Data Processing Layer Overlay LAYERS NASA SeaWiFS Satellite RPO VIEWS Chemistry NOAA ATAD Trajectory OGC Map Boundary WS Benefits:Composition of Data Views from Distributed Data and Web Services Web Service Composition
Some of the Tools Used in FASTNET • Data Catalog • Data Browser • PlumeSim, Animator • Combined Aerosol Trajectory Tool (CATT) Consoles: Data from diverse sources are displayed to create a rich context for exploration and analysis Viewer: General purpose spatio-temporal data browser and view editor applicable for all DataFed datasets CATT: Combined Aerosol Trajectory Tool for the browsing backtrajectories for specified chemical conditions
A Sample of Datasets Accessible through ESIP MediationNear Real Time (~ day) It has been demonstrated (project FASTNET) that these and other datasets can be accessed, repackaged and delivered by AIRNow through ‘Consoles’ MODIS Reflectance MODIS AOT TOMS Index MODIS Fire Pix GOES AOT GOES 1km Reflec NEXTRAD Radar NWS Surf Wind, Bext NRL MODEL
Web Services: Building Blocks of DataFed ProgrammingAccess, Process, Render Data by Service Chaining [Station] Map boundary layer Clickable monitor locations layer [Monitor]
GetCapabilities Server Std. Interface Std. Interface Client Capabilities, DataProfile Front End Back End Where? When? What? Which Format? GetData Data T1 T2 Generic Data Interoperability Client-Server Communication Protocol Data Coding Geo-reference Time-code Std names Model, format
Data Interoperability Groups, Activities Interoperability Stack and Connectivity Example Protocol Stack Composition: Data Access: Metadata: Data Formats: Server BPEL, AJAX, .Net SOAP, OGC-W*S CF, EOS, OGC-W*S netCDF, HDF, geoTIFF Client JScript, .Net, AJAX OGC-WCS CF netCDF, GRIB
Data Interoperability Groups, Activities Interoperability Stack and Connectivity Example Protocol Stack Composition: Data Access: Metadata: Data Formats: Server BPEL, AJAX, .Net SOAP, OGC-W*S CF, EOS, OGC-W*S netCDF, HDF, geoTIFF Client JScript, .Net, AJAX OGC-WCS CF netCDF, GRIB
WMS Data View Services WCS SOS SOS SensorML WMS WFS Stations Observations Par-Meth Star Schema Param/Sensor/Method Station Info. Relational Data Model Observations
Service Flow Program for a VIEW View • <ServiceFlow> • <View> • <MapImageMargin ref="ws_margins" /> • <AnnotateImage ref="ws_title" icon_text="T" label="Title" execute="true" /> • <StockAnnotation ref="DATAFED" /> • <StockAnnotation ref="CIRA" /> • <AnnotateImage ref="ws_cursor_annotation" icon_text="C" label="Cursor" execute="true" /> • </View> • <Layers current="Traj_Grid" order="Traj_Grid Traj_Point Traj_Line MapImage_1"> • <Layer id="Traj_Line" dataset_abbr="VIEWS_OL" visible="false" visibility="1" click_target="true"> • <DataMapTimePoint ref="ws_data" label="Query Filter" /> • <DataMapTrajectory ref="ws_traj_render" show_data="false" icon_text="TR" /> • <AnnotateImage ref="ws_network_legend" icon_text="N" label="Network Legend" execute="true" execute_always="true" /> • </Layer> • <Layer id="Traj_Point" dataset_abbr="VIEWS_OL" visible="true" visibility="1" click_target="true"> • <DataMapPoint ref="ws_point_data" show_data="false" /> • <DataMapPoint ref="ws_store_cursor_value" /> • <RenderMapPoint ref="ws_point_render" icon_text="RP" label="point rendering" /> • <MapParamLocationAccessRender ref="ws_loc" execute_always="true" /> • <RenderLegend ref="ws_pntleg" icon_text="L" label="Point Legend" execute="true" execute_always="true" /> • </Layer> • <Layer id="Traj_Grid" dataset_abbr="VIEWS_OL" visible="true" visibility="1"> • <DataMapTimePoint ref="ws_ref_data" label="Reference Query Filter" /> • <DataMapTrajectory ref="ws_ref_traj_grid" icon_text="TG" /> • <DataMapTimePoint ref="ws_data" label="Query Filter" /> • <DataMapTrajectory ref="ws_traj_grid" icon_text="TG" /> • <MapGridOperator ref="ws_mgo" /> • <RenderMapGrid ref="ws_rg" /> • <RenderLegend ref="ws_rainbow" icon_text="L" label="Rainbow Legend" execute="true" execute_always="true" /> • </Layer> • <Layer id="MapImage_1" dataset_abbr="MapImage" visible="true" visibility="1"> • <MapImageAccessRender ref="ws_map_image" /> • </Layer> • </Layers> • </ServiceFlow> Layer Layer Layer Layer
Benefits of WMS Compatibility: Geospatial One-Stop Provides Access to DataFed spatial layers through WMS Problem: No Time Dim! DataFed/VIEWS Asian Dust Concentration (circles) S. Falke http://www.datafed.net/DataLinks/OGC/OGC.htm
GALEON Interoperability Experiment Unify Earth Science & GIS Data Flows GALEON Geo-interface for Atmosphere, Land, Earth, and Ocean netCDF Lead by UNIDATA & OGC Participants: academia, industry, international GALEON UNIDATA B. Domenico B. Domenico
HTTP GET/POST based interfaces Services have XML service descriptions (“Capabilities”, “Description”) Filter parameters allow selection of subsets of source data Output formats advertised by each service instance OGC Web Coverage Service (WCS) Specification WCS is for "coverages" – information representing space-time-varying phenomena WCS describes, requests and deliverscoverages in spatio-temporal domain WCS version 1.1 is limited to grids/"simple” coverages with homogeneous range sets OGC WCS getCoverage SchemaSuitable for wrapping with SOAP envelope, WSDL access, loose coupling
Explore Data Info Needs Federate Data Understand Viewers Reports Slice & Dice Programs AQ Compliance Nowcast/Forecast Status & Trends Find Data Gaps ID New Problems ……… Wrappers Structuring Integrate What? When? Where? • The info system infrastructure needs to facilitate the creation of info products • The challenge is to design a general supportive infrastructure Data Users Data Providers Non-intrusive Linking & Mediation • Simply connecting the relevant provides and users for each info product is messy • Structuring the heterogeneous data into where-when-what ‘cubes’ simplifies the mess • The ‘cubed’ data can be accessed and explored by slicing-dicing tools • More elaborate data integration and fusion can be done by web service chaining • This infrastructure support for IDAQ can be provided by the ESIP Federation Integrated Data System for Air Quality-IDAQ Providers Emission Surface Satellite Model Single Datasets • Providers supply the ‘raw material’ (data and models) for ‘refined’ info products ESIP AQ Cluster 050510 Draft rhusar@me.wustl.edu