Download
1 / 12
120 likes | 260 Views
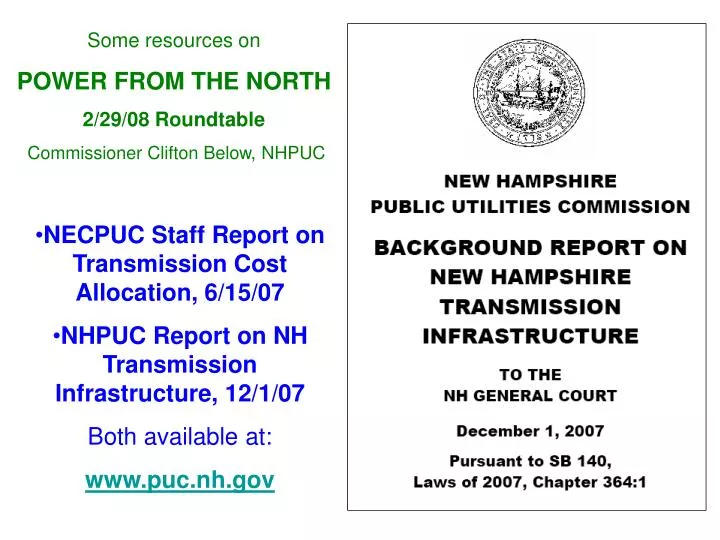
Some resources on POWER FROM THE NORTH 2/29/08 Roundtable Commissioner Clifton Below, NHPUC. NECPUC Staff Report on Transmission Cost Allocation, 6/15/07 NHPUC Report on NH Transmission Infrastructure, 12/1/07 Both available at: www.puc.nh.gov. What Resources Really Will be Available?

E N D
Some resources on POWER FROM THE NORTH 2/29/08 Roundtable Commissioner Clifton Below, NHPUC • NECPUC Staff Report on Transmission Cost Allocation, 6/15/07 • NHPUC Report on NH Transmission Infrastructure, 12/1/07 • Both available at: • www.puc.nh.gov
What Resources Really Will be Available? Good Question, depends, in part, on transmission (also siting & finances)
NW Maine Northern NH NE Vermont
One Biomass Example: • Just this week Clean Power Development, LLC gave NH Site Evaluation Committee a head’s up that they would soon be filing 3 applications for RPS qualified renewable bio-mass fueled projects: • 38.5 MW Merrimack cogeneration next to Anheuser-Busch Brewery • 50 MW Winchester base loaded in SW NH • 30-40 MW Berlin cycling plant next to waste water treatment facility
Rising Concerns about Rising Cost of Transmission as a Rate Component
Who Pays? With $3-6 Billion More of Reliability Upgrades in the Pipeline
Many other regions (around the world, e.g ON, NZ) dealing with similar ?s of process for deciding what transmission to build to connect renewable resources to load and how to pay. • 1 interesting case in point: SPP RSC has responsibility for cost allocation & rate design. • Through stakeholder process (CAWG) SPP RSC has adopted Concepts Paper on Economic Upgrades (1/28/08) for implementing with SPP RTO.
SPP: “Balanced Economic Portfolio” • Ensure that some SPP transmission customers are not benefiting at the a cost to others. • 10 yr NPV of benefits (to customers) > 10 yr NPV of levelized revenue requirement for upgrade. • For an acceptable portfolio, at zonal level, no zone should have benefits < than costs. • If not then some zonal adjustments through additonal upgrades or cost transfers to pool rate.
Final Thought • Over time, climate science, and resulting policy recommendations, public opinion and political will are steadily trending to need for more carbon reductions sooner than later to avoid serious and costly consequences of global warming. • We need to figure this out and move forward to capture as many GHG reductions, as cost effectively, on as many fronts, as quickly, as we possibly can.