Download
1 / 49
490 likes | 648 Views
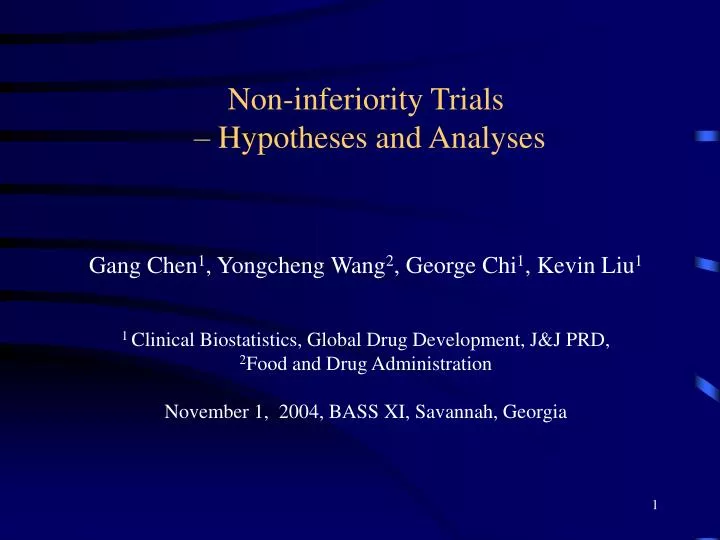
Non-inferiority Trials – Hypotheses and Analyses. Gang Chen 1 , Yongcheng Wang 2 , George Chi 1 , Kevin Liu 1 1 Clinical Biostatistics, Global Drug Development, J&J PRD, 2 Food and Drug Administration November 1, 2004, BASS XI, Savannah, Georgia. Outline.

E N D
Non-inferiority Trials – Hypotheses and Analyses Gang Chen1, Yongcheng Wang2, George Chi1, Kevin Liu1 1 Clinical Biostatistics, Global Drug Development, J&J PRD, 2Food and Drug Administration November 1, 2004, BASS XI, Savannah, Georgia
Outline • Non-inferiority (NI) hypotheses • fixed margin • fraction retention • Analysis methods • Example • Major issues and summary
NI Hypotheses Fraction retention/ Fixed margin
Notations • Endpoint: time to event (e.g., survival, TTP) • Hazard ratio: HR(T/C) and HR(P/C) • Treatment effect: 1 = HR(T/C) -1 • Control effect: 2 = HR(P/C) -1 • Fraction retention of control effect: = 1 – {1 / 2}, or • Fraction loss of control effect 1 - = 1 / 2, where, T, C and P are treatment, control and placebo respectively.
NI hypotheses – Fraction retention • Fraction retention NI hypotheses: H0: 1/2 1 -0 vs. Ha: 1/2 < 1- 0, or, if 2 > 0, H0: 1 – (1- 0)2 0 vs. Ha: 1 – (1 - 0)2 < 0.
NI Hypotheses-fraction retention Selection of fraction retention The selection of fraction retention depends on several factors: • objective of active control trial • claim non-inferiority or equivalence • claim efficacy • clinical judgment • statistical judgment • distributional properties of the ratio of treatment effect vs. active control effect • mean effect size of active control • variability of active control effect
NI hypotheses – Fixed margin • If fix control effect 2 = M1 > 0, and define margin M = M1*0, where 0 is a fixed level of fraction retention, then NI hypotheses become: H0: 1/M1 0 vs. Ha: 1/M1 <0, or H0: HR(T/C) 1+M vs. Ha: HR(T/C) < 1+M
NI hypotheses-Fixed margin Margin selection: • Arbitrary margin: questionable • Margin based on control effect ~ two CI method: Based on the lower limit (LL) of% CI for HR(P/C), i.e. Margin = 0*(LL %CI for HR(P/C) -1) e.g., 0 = .5 & LL of %CI = 1.2, then margin = .1 If the 95% CI for HR(T/C) lies entirely beneath 1 + margin (NI cutoff), “non-inferiority” is concluded
NI hypotheses-Fixed margin Two CI approach: 95 % CI for HR(T/C) % CI (cutoff) for HR(P/C) HR 1.0
NI hypotheses-Fixed margin Margin selection, for example: • =0: margin = point estimate • = .3: margin = LL of 30% CI • =.95: margin = LL of 95% CI
NI hypotheses-Fixed marginmargin and type I error: Point Estimate ( >> 0.025) Lower 95% C.L. ( << 0.025) Lower % C.L. ( = 0.025)
Assessment of control effect • There should be some historical randomized, double-blind and placebo controlled studies involving the active control. • Modeling active control effect using a meta-analysis (either random effects or fixed effects model). • Random effects model may be preferred because it provides a more appropriate standard error. • When there is only one or two historical active control trials, it is difficult to assess the control effect and the between study variability may not be appropriately assessed.
Assessment of control effect • Constancy of the control effect: Current active control effect needs to be assessed with the following consideration • Changes in populations? • Changes in standard care, or medical practice (including concomitant medications)? • Appropriate adjustment may be necessary if the constancy assumption my be wrong: • Adjustment for control effect size • Adjustment for characteristics of patient population
Interpretation of NI hypotheses • The discussion and interpretation of fixed margin NI hypotheses and fraction retention NI hypotheses are given in [1] [2]. [1] George YH Chi, Gang Chen, Mark Rothmann, Ning Li (2003), Active Control Trials. Encyclopedia of Biopharmaceutical Statistics: Second Edition. [2] Mark Rothmann, Ning Li, Gang Chen, George Y.H. Chi, Hsiao-Hui Tsou, and Robert Temple (2003), Design and analysis of non-inferiority mortality trials in oncology, Statistics in Medicine. Vol. 22: 239-264.
NI test procedure Non-inferiority test procedure: • Step 1: assessing control effect 2based on historical randomized trials. If control effect is positive, then • Step 2: assuming 2 > 0 (control is effective) and formulate fraction retention NI hypotheses (or fixed margin hypotheses with 2 = M): H0: 1/2 1 -0 vs. Ha: 1/2 < 1- 0, or, if 2 > 0, H0: 1 – (1- 0)2 0 vs. Ha: 1 – (1 - 0)2 < 0. • Step 3: drawing inference with alpha < 0.05 for NI hypotheses and claiming NI.
NI test procedure • One concern on NI test procedure: The false positive rate associated with the non-inferiority test procedure may be inflated. The details have been discussed in [1]. [1] Gang Chen, Yong-Cheng Wang, George Chi (2004), Hypotheses and type I error in active control non-inferiority trials, Journal of Biopharmaceutical Statistics, Journal of Biopharmaceutical Statistics. JBS, Vol. 14, No. 2, pp 301-313.
Statistical Tests • Linear test (Rothmann) • Ratio test (Wang) • Two 95% CI • CI for the ratio (H/K) • Bayesian (Simon)
Linear test • NI hypotheses: Assuming HR(P/C) > 1 H0(1): logHR(T/C) (1-0)logHR(P/C) vs. Ha(1): logHR(T/C) < (1-0)logHR(P/C)
Linear test • Test statistic for H0(1) vs. Ha(1): where and are the estimates of hazard ratios, and
Linear testNormality, Power and Sample size • Details given in the paper: Mark Rothmann, Ning Li, Gang Chen, George Y.H. Chi, Hsiao-Hui Tsou, and Robert Temple (2003), Design and analysis of non-inferiority mortality trials in oncology, Statistics in Medicine. Vol. 22: 239-264.
Ratio Test • Hypothesis: H0: <0 vs. Ha: >0
Ratio Test • Estimate of : where and are estimates of hazard ratios.
Ratio Test • Test statistic: Concern: Is Z* normal?
Ratio TestAsymptotic Normality of Z* • Interim statistic: • Zk* is approximately normally distributed, and
Ratio TestAsymptotic Normality of Z* • Z* will quickly converge to the standard normal distribution, i.e., Z*~ N(0, 1)
Ratio TestAsymptotic Normality of Z* Normality of Z* (Xeloda trials, simulation runs=100,000) where p = proportion of simulation runs passed Shapiro-Wilk test.
Two 95% CI Method Two 95% CI method: • Define the non-inferiority cutoff (1+margin) as 1 + (0.5)(LL of 95% CI for HR(P/C) - 1). • If the 95% CI for HR(T/C) lies entirely beneath this cutoff, non-inferiority is concluded.
Hasselblad & Kong A “95%” confidence interval is calculated using a normal distribution with standard error
Example Xeloda vs 5-FU+LV
Xeloda trial • Phase III Active Controlled Study • Indication: First-line Metastatic Colorectal Cancer • Rx: Xeloda (Capecitabine) • Active Control: 5-FU+LV • Primary endpoint: survival
Active control effect • Survival endpoint: HR(P/C) • Multiple placebo controlled studies conducted for control effect • Current trial population is similar to historical trial population(s) • The effect size is not small.
Active control effect (5FU vs. 5FU/LV) Random Effects Meta- analysis Model results based on ten trials
Results of Xeloda and 5FU/LV trials Xeloda trial: • HR(T/C)=HR(Xeloda/5FU+LV)=0.92 • logHR(T/C)=-0.0844, SE(logHR)=0.087 Meta-analysis of 5FU/LV trials: • HR(P/C)=1.264, • logHR(P/C)=0.234, SE(logHR(P/C)=0.075
Linear Test • defined using log HR, H0: < 0.5, Z*=-2.13 Trial ^ p-value Study Power 95% CI of ^ Xeloda 136.0% 0.0165 45.62% (59.0%, 260%)
Ratio Test Trial ^ p-value Study Power 95% CI of ^ Xeloda 130.7% 0.0109 62.34% (72.9%, 188%)
Two 95% CI Method HR1 95% CI Cutoff2 Fraction Demonstrated 0.92 0.78-1.09 1.046 2% 1HR: Hazard Ratio of Xeloda/5-FU/LV 2Cutoff for 50% retention.
Hasselblad & Kong’s Method • Estimated δ=1.36 • 95% CI is: 0.596-2.124
Bayesian Method - Non-informative Priors • Normal posterior probability distributions (or a posterior bivariate normal distribution) are determined from non-informative priors. • A posterior probability is found for the event that both log HR(T/C2) <(1-d)log HR(P1/C1) and log HR(P1/C1) >0. If this probability is greater than 0.975, non-inferiority is concluded.
Bayesian Method • Joint Prob (logHR(T/C2)<(1-delta)logHR(P1/C1)) and logHR(C/P)>0 = 0.987.
Major issues • The following are important design, conduct, analysis and interpretation issues • The choice of endpoints • The selection of the non-concurrent or historical studies • The modeling of the active control effect • The formulation of the hypotheses • The choice of fraction retention/margin • The interpretation of the results
Summary • If control effect is small, active control trial should be a “superiority” trial, not a “non-inferiority” trial. • Appropriate assessment of the control effect based on historical data may be difficult when • few trials • changing the population • changing the standard care • Selection of the fraction retention should be based on both clinical and statistical judgment. • Interpretation of results needs to be with caution.
END Thanks