Download
1 / 40
400 likes | 533 Views
Air Resources in Western National Parks. Chris Shaver Air Resources Division National Park Service. WRAP Meeting Sept 13, 2006. The public values:. Our Lands, Our Legacy. A natural environment, including clean, clear air

E N D
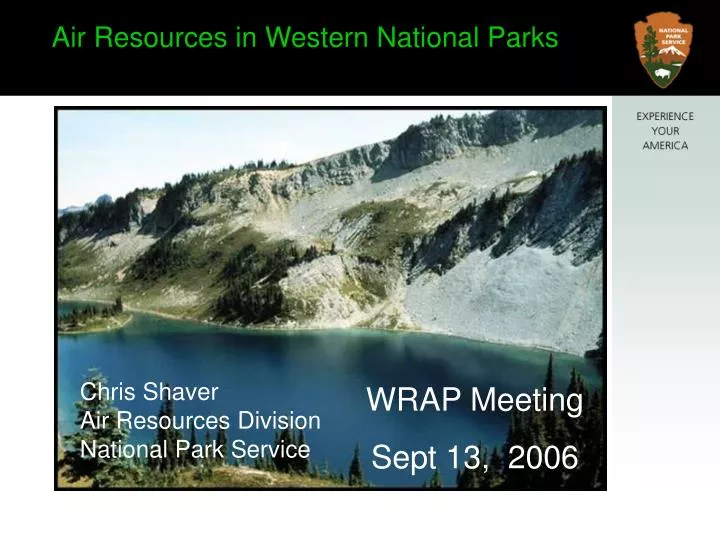
Air Resources in Western National Parks Chris Shaver Air Resources Division National Park Service WRAP Meeting Sept 13, 2006
The public values: Our Lands, Our Legacy • A natural environment, including clean, clear air • Knowing that special areas have been set aside and that they’re being protected for future generations
Air Quality Trends in National Parks, 1995-2004 FY2005 Annual Performance Report For NPS Government Performance and Results Act (GPRA) Air Quality Goal Ia3 OLYMPIC N. CASCADES GLACIER MT RAINIER ISLE ROYALE VOYAGEURS ACADIA T. ROOSEVELT LITTLE BIGHORN CRATER LAKE YELLOWSTONE CRATERS OF THE MOON CAPE COD BADLANDS REDWOOD LASSEN VOLCANIC INDIANA DUNES ROCKY MOUNTAIN POINT REYES WASHINGTON, DC GREAT BASIN YOSEMITE CANYONLANDS SHENANDOAH BRYCE CANYON GREAT SAND DUNES PINNACLES Improving (p<=0.05) SEQUOIA DEATH VALLEY MESA VERDE MAMMOTH CAVE GRAND CANYON Degrading (p<=0.05) CAPULIN VOLCANO GREAT SMOKY MTS BUFFALO PETRIFIED FOREST COWPENS JOSHUA TREE BANDELIER CHANNEL ISLANDS No Trend / Stable TONTO GILA CLIFF No Data / Insufficient Data CONGAREE ORGAN PIPE SAGUARO CHIRICAHUA GUADALUPE MTS Ozone CHAMIZAL Visibility-Clear Days BIG BEND DENALI Visibility-Hazy Days Sulfate in Precipitation EVERGLADES Nitrate in Precipitation VIRGIN ISLANDS Ammonium in Precipitation 12/02/2005
Annual 4th Highest daily maximum 8-hour average 0zone (ppb) 2005
Downward pointing arrows denote trends toward decreasing ozone concentrations and improving air quality. Similarly, the up arrows correspond to trends toward higher ozone concentrations and hence worsening air quality. Park names underlined in red denote parks where monitored ozone levels exceed the level of the NAAQS or are part of an ozone non-attainment area.
Ozone Effects to Vegetation Normal leaf Ozone-injured leaf How does ozone affect sensitive species? - Visible symptoms - Physiological symptoms • Reduced photosynthesis • Reduced growth • - Acute vs. chronic injury Aspen Ponderosa pine
Wet Nitrate Deposition and Trends 2-3 KG/HA (NO3) (0.4-0.6 OF N)
Wet Ammonium Deposition and Trends 1 kg/ha (NH4) (0.8 N) Christopher M.B. Lehmanna, Van C. Bowersoxa, Susan M. Larsonb
Rocky Mountain National Park: Nitrogen Deposition Effects on Park Ecosystems • 20+ yr research; 80+ published studies on nitrogen deposition and impacts at ROMO (by USGS researchers Baron, Campbell and others) • Nitrogen contributes to ozone, visibility impairment, and deposition that are altering the natural ecosystems and enjoyment of the park • Nitrogen is increasing and impacts are increasing • Nitrogen impacts have been documented to soils, waters, vegetation in high elevation areas on the east side of the park.
Ecosystem Thresholds and Critical Loads “Critical Loads” is a term used to describe: • Has air pollution reached a tipping point (threshold) for effects on plants, animals, soils, or water? • What amount of N or S deposition causes that tipping point?
Rocky Mountain National Park: Continuum of Impacts to Ecological Health Current N deposition in Rocky Mountain NP N Load (kg/ ha /yr)- wet 3.1 kg/ha/yr 1.5 kg/ha/yr “weight of evidence” of ecosystem health decline on east side of park Natural background N deposition 0.5 kg/ha/yr Effects on aquatic animals (episodic acidification) Forest decline (acidification effects on trees) Changes in soil & water chemistry Surface water N saturation Changes in tree chemistry Change in aquatic plant species composition Change in alpine plant species Lethal effects on fish, other aquatic animals (chronic acidification)
Reverse the Trend Elevated N in spruce tree needles: Future Consequences?: If nitrogen continues to accumulate in high elevation soils at current rates, acidification could occur within decades Actions: NPS is currently working with EPA and the State of Colorado to develop a plan to reduce nitrogen deposition to the park to levels protective of sensitive aquatic and terrestrial plants, soils, waters
Scientific Approaches to Develop Critical Loads • NPS research on sensitive receptors and endpoints ongoing at: • Rocky Mountain NP, Glacier NP, Yellowstone NP, Grand Teton NP, Great Sand Dunes NP • Shenandoah NP, Great Smoky Mountains NP • Mount Rainier NP, North Cascades • Big Bend NP, Joshua Tree NP • Modeling being tested at: • Rocky Mountain, Great Smoky, Mt Rainier, Acadia and Joshua Tree • Other FLMs also conducting empirical studies and modeling to establish critical loads
Climate Change: Resources at Risk • Physical Effects: • Alteration of climate patterns • Precip pattern change • Snowpack decline • Glaciers melt • Oceans warm • Air pollution increase • Ecological Effects: • Plants flower sooner • Birds nest earlier • Migration patterns change • Loss of synchrony between predator & prey • Pests survive at higher elevations • Pathogens spread • Altered aquatic and terrestrial communities
Burial Lake, NOATAK National Preserve Western Airborne Contaminants Assessment Project WACAP GOAL: TO ASSESS THE DEPOSITION OF AIRBORNE CONTAMINANTS IN WESTERN NATIONAL PARKS, PROVIDING REGIONAL AND LOCAL INFORMATION ON EXPOSURE, ACCUMULATION, IMPACTS AND PROBABLE SOURCES
Key Scientific/Ecological Questions 1.) Are contaminants present in western National Parks? 2.) Where do contaminants accumulate (ecologically and geographically)? 3.) Which contaminants pose the greatest ecological threat? 4.) Which indicators are the most useful in interpreting contamination? 5.) What are the probable sources of the air masses most likely to have transported contaminants to the National Park sites?
Catchment Trans-Pacific Pathway Eurasia Snow Annual flux Regional Sources North America Lake Sediments Chronology Fish Contaminants vs. age, Condition Factors, Response Factors Lichen N, S, HM Subsistence Link (moose) “Vegetation” Intensify spatial coverage – more National Parks WACAP Indicators and Conceptual Diagram Lake Water Dissolved and Particulate Summer
For More Info • Join 3 million people every week at: • www2.nature.nps.gov/air