Download
1 / 1
10 likes | 156 Views
Solid Precipitation Instrumentation, Monitoring and Evaluation in the USDA-NRCS and the USA CRREL. Greg Johnson and Garry Schaefer, USDA-NRCS National Water and Climate Center, Portland Oregon Rick McClure, USDA-NRCS, Alaska State Office, Anchorage, Alaska

E N D
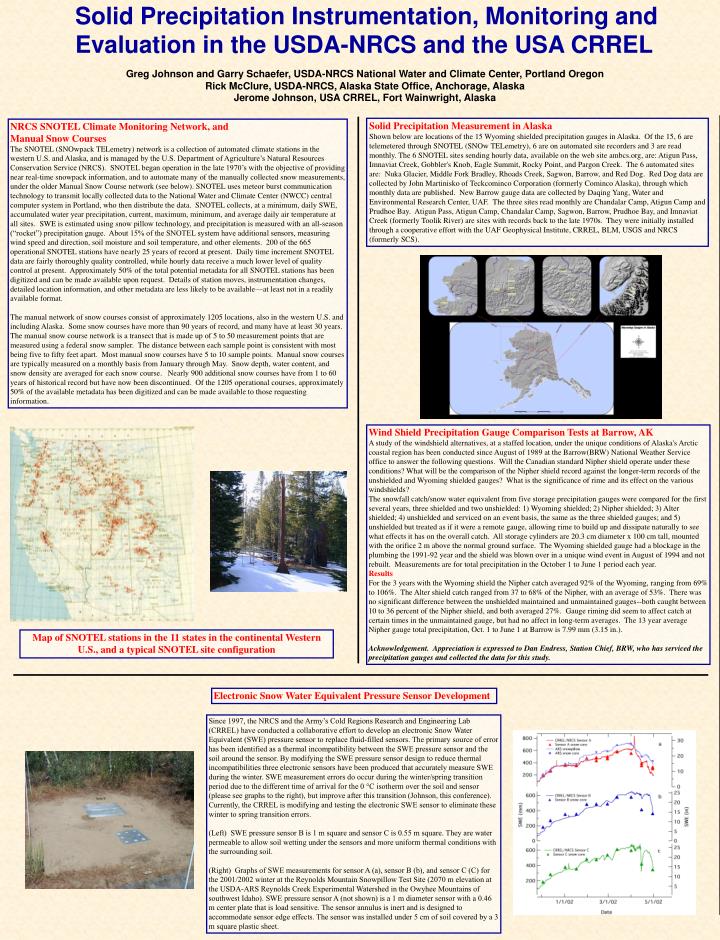
Solid Precipitation Instrumentation, Monitoring and Evaluation in the USDA-NRCS and the USA CRREL Greg Johnson and Garry Schaefer, USDA-NRCS National Water and Climate Center, Portland Oregon Rick McClure, USDA-NRCS, Alaska State Office, Anchorage, Alaska Jerome Johnson, USA CRREL, Fort Wainwright, Alaska Solid Precipitation Measurement in Alaska Shown below are locations of the 15 Wyoming shielded precipitation gauges in Alaska. Of the 15, 6 are telemetered through SNOTEL (SNOw TELemetry), 6 are on automated site recorders and 3 are read monthly. The 6 SNOTEL sites sending hourly data, available on the web site ambcs.org, are: Atigun Pass, Imnaviat Creek, Gobbler's Knob, Eagle Summit, Rocky Point, and Pargon Creek. The 6 automated sites are: Nuka Glacier, Middle Fork Bradley, Rhoads Creek, Sagwon, Barrow, and Red Dog. Red Dog data are collected by John Martinisko of Teckcominco Corporation (formerly Cominco Alaska), through which monthly data are published. New Barrow gauge data are collected by Daqing Yang, Water and Environmental Research Center, UAF. The three sites read monthly are Chandalar Camp, Atigun Camp and Prudhoe Bay. Atigun Pass, Atigun Camp, Chandalar Camp, Sagwon, Barrow, Prudhoe Bay, and Imnaviat Creek (formerly Toolik River) are sites with records back to the late 1970s. They were initially installed through a cooperative effort with the UAF Geophysical Institute, CRREL, BLM, USGS and NRCS (formerly SCS). NRCS SNOTEL Climate Monitoring Network, and Manual Snow Courses The SNOTEL (SNOwpack TELemetry) network is a collection of automated climate stations in the western U.S. and Alaska, and is managed by the U.S. Department of Agriculture’s Natural Resources Conservation Service (NRCS). SNOTEL began operation in the late 1970’s with the objective of providing near real-time snowpack information, and to automate many of the manually collected snow measurements, under the older Manual Snow Course network (see below). SNOTEL uses meteor burst communication technology to transmit locally collected data to the National Water and Climate Center (NWCC) central computer system in Portland, who then distribute the data. SNOTEL collects, at a minimum, daily SWE, accumulated water year precipitation, current, maximum, minimum, and average daily air temperature at all sites. SWE is estimated using snow pillow technology, and precipitation is measured with an all-season (“rocket”) precipitation gauge. About 15% of the SNOTEL system have additional sensors, measuring wind speed and direction, soil moisture and soil temperature, and other elements. 200 of the 665 operational SNOTEL stations have nearly 25 years of record at present. Daily time increment SNOTEL data are fairly thoroughly quality controlled, while hourly data receive a much lower level of quality control at present. Approximately 50% of the total potential metadata for all SNOTEL stations has been digitized and can be made available upon request. Details of station moves, instrumentation changes, detailed location information, and other metadata are less likely to be available—at least not in a readily available format. The manual network of snow courses consist of approximately 1205 locations, also in the western U.S. and including Alaska. Some snow courses have more than 90 years of record, and many have at least 30 years. The manual snow course network is a transect that is made up of 5 to 50 measurement points that are measured using a federal snow sampler. The distance between each sample point is consistent with most being five to fifty feet apart. Most manual snow courses have 5 to 10 sample points. Manual snow courses are typically measured on a monthly basis from January through May. Snow depth, water content, and snow density are averaged for each snow course. Nearly 900 additional snow courses have from 1 to 60 years of historical record but have now been discontinued. Of the 1205 operational courses, approximately 50% of the available metadata has been digitized and can be made available to those requesting information. Wind Shield Precipitation Gauge Comparison Tests at Barrow, AK A study of the windshield alternatives, at a staffed location, under the unique conditions of Alaska's Arctic coastal region has been conducted since August of 1989 at the Barrow(BRW) National Weather Service office to answer the following questions. Will the Canadian standard Nipher shield operate under these conditions? What will be the comparison of the Nipher shield record against the longer-term records of the unshielded and Wyoming shielded gauges? What is the significance of rime and its effect on the various windshields? The snowfall catch/snow water equivalent from five storage precipitation gauges were compared for the first several years, three shielded and two unshielded: 1) Wyoming shielded; 2) Nipher shielded; 3) Alter shielded; 4) unshielded and serviced on an event basis, the same as the three shielded gauges; and 5) unshielded but treated as if it were a remote gauge, allowing rime to build up and dissipate naturally to see what effects it has on the overall catch. All storage cylinders are 20.3 cm diameter x 100 cm tall, mounted with the orifice 2 m above the normal ground surface. The Wyoming shielded gauge had a blockage in the plumbing the 1991-92 year and the shield was blown over in a unique wind event in August of 1994 and not rebuilt. Measurements are for total precipitation in the October 1 to June 1 period each year. Results For the 3 years with the Wyoming shield the Nipher catch averaged 92% of the Wyoming, ranging from 69% to 106%. The Alter shield catch ranged from 37 to 68% of the Nipher, with an average of 53%. There was no significant difference between the unshielded maintained and unmaintained gauges--both caught between 10 to 36 percent of the Nipher shield, and both averaged 27%. Gauge riming did seem to affect catch at certain times in the unmaintained gauge, but had no affect in long-term averages. The 13 year average Nipher gauge total precipitation, Oct. 1 to June 1 at Barrow is 7.99 mm (3.15 in.). Acknowledgement. Appreciation is expressed to Dan Endress, Station Chief, BRW, who has serviced the precipitation gauges and collected the data for this study. Map of SNOTEL stations in the 11 states in the continental Western U.S., and a typical SNOTEL site configuration Electronic Snow Water Equivalent Pressure Sensor Development Since 1997, the NRCS and the Army’s Cold Regions Research and Engineering Lab (CRREL) have conducted a collaborative effort to develop an electronic Snow Water Equivalent (SWE) pressure sensor to replace fluid-filled sensors. The primary source of error has been identified as a thermal incompatibility between the SWE pressure sensor and the soil around the sensor. By modifying the SWE pressure sensor design to reduce thermal incompatibilities three electronic sensors have been produced that accurately measure SWE during the winter. SWE measurement errors do occur during the winter/spring transition period due to the different time of arrival for the 0 °C isotherm over the soil and sensor (please see graphs to the right), but improve after this transition (Johnson, this conference). Currently, the CRREL is modifying and testing the electronic SWE sensor to eliminate these winter to spring transition errors. (Left) SWE pressure sensor B is 1 m square and sensor C is 0.55 m square. They are water permeable to allow soil wetting under the sensors and more uniform thermal conditions with the surrounding soil. (Right) Graphs of SWE measurements for sensor A (a), sensor B (b), and sensor C (C) for the 2001/2002 winter at the Reynolds Mountain Snowpillow Test Site (2070 m elevation at the USDA-ARS Reynolds Creek Experimental Watershed in the Owyhee Mountains of southwest Idaho). SWE pressure sensor A (not shown) is a 1 m diameter sensor with a 0.46 m center plate that is load sensitive. The sensor annulus is inert and is designed to accommodate sensor edge effects. The sensor was installed under 5 cm of soil covered by a 3 m square plastic sheet.