Download
1 / 1
10 likes | 179 Views
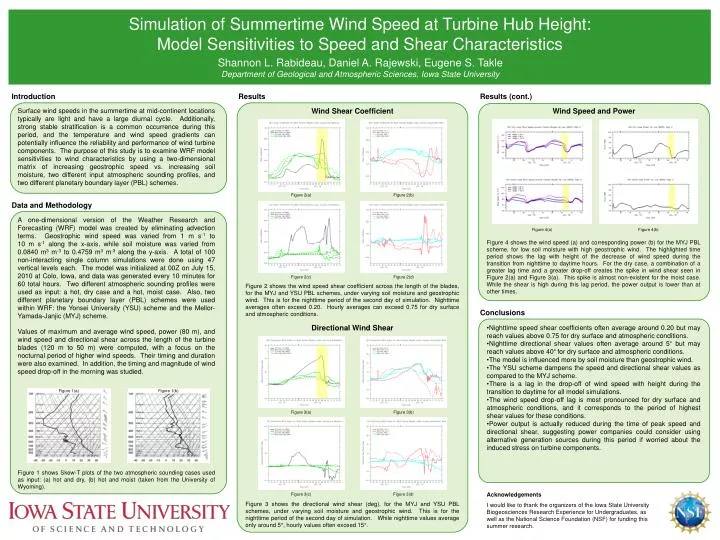
Simulation of Summertime Wind Speed at Turbine Hub Height: Model Sensitivities to Speed and Shear Characteristics. Shannon L. Rabideau, Daniel A. Rajewski , Eugene S. Takle Department of Geological and Atmospheric Sciences, Iowa State University. Introduction. Results. Results (cont.).

E N D
Simulation of Summertime Wind Speed at Turbine Hub Height: Model Sensitivities to Speed and Shear Characteristics Shannon L. Rabideau, Daniel A. Rajewski, Eugene S. Takle Department of Geological and Atmospheric Sciences, Iowa State University Introduction Results Results (cont.) Wind Shear Coefficient Wind Speed and Power Surface wind speeds in the summertime at mid-continent locations typically are light and have a large diurnal cycle. Additionally, strong stable stratification is a common occurrence during this period, and the temperature and wind speed gradients can potentially influence the reliability and performance of wind turbine components. The purpose of this study is to examine WRF model sensitivities to wind characteristics by using a two-dimensional matrix of increasing geostrophic speed vs. increasing soil moisture, two different input atmospheric sounding profiles, and two different planetary boundary layer (PBL) schemes. Figure 2(a) Figure 2(b) Data and Methodology A one-dimensional version of the Weather Research and Forecasting (WRF) model was created by eliminating advection terms. Geostrophic wind speed was varied from 1 m s-1 to 10 m s-1 along the x-axis, while soil moisture was varied from 0.0840 m3 m-3 to 0.4759 m3 m-3 along the y-axis. A total of 100 non-interacting single column simulations were done using 47 vertical levels each. The model was initialized at 00Z on July 15, 2010 at Colo, Iowa, and data was generated every 10 minutes for 60 total hours. Two different atmospheric sounding profiles were used as input: a hot, dry case and a hot, moist case. Also, two different planetary boundary layer (PBL) schemes were used within WRF: the Yonsei University (YSU) scheme and the Mellor-Yamada-Janjic (MYJ) scheme. Values of maximum and average wind speed, power (80 m), and wind speed and directional shear across the length of the turbine blades (120 m to 50 m) were computed, with a focus on the nocturnal period of higher wind speeds. Their timing and duration were also examined. In addition, the timing and magnitude of wind speed drop-off in the morning was studied. Figure 4(a) Figure 4(b) Figure 4 shows the wind speed (a) and corresponding power (b) for the MYJ PBL scheme, for low soil moisture with high geostrophic wind. The highlighted time period shows the lag with height of the decrease of wind speed during the transition from nighttime to daytime hours. For the dry case, a combination of a greater lag time and a greater drop-off creates the spike in wind shear seen in Figure 2(a) and Figure 3(a). This spike is almost non-existent for the moist case. While the shear is high during this lag period, the power output is lower than at other times. Figure 2(c) Figure 2(d) Figure 2 shows the wind speed shear coefficient across the length of the blades, for the MYJ and YSU PBL schemes, under varying soil moisture and geostrophic wind. This is for the nighttime period of the second day of simulation. Nighttime averages often exceed 0.20. Hourly averages can exceed 0.75 for dry surface and atmospheric conditions. Conclusions Directional Wind Shear • Nighttime speed shear coefficients often average around 0.20 but may reach values above 0.75 for dry surface and atmospheric conditions. • Nighttime directional shear values often average around 5° but may reach values above 40° for dry surface and atmospheric conditions. • The model is influenced more by soil moisture than geostrophic wind. • The YSU scheme dampens the speed and directional shear values as compared to the MYJ scheme. • There is a lag in the drop-off of wind speed with height during the transition to daytime for all model simulations. • The wind speed drop-off lag is most pronounced for dry surface and atmospheric conditions, and it corresponds to the period of highest shear values for these conditions. • Power output is actually reduced during the time of peak speed and directional shear, suggesting power companies could consider using alternative generation sources during this period if worried about the induced stress on turbine components. Figure 1(a) Figure 1(b) Figure 3(a) Figure 3(b) Figure 1 shows Skew-T plots of the two atmospheric sounding cases used as input: (a) hot and dry, (b) hot and moist (taken from the University of Wyoming). Acknowledgements I would like to thank the organizers of the Iowa State University Biogeosciences Research Experience for Undergraduates, as well as the National Science Foundation (NSF) for funding this summer research. Figure 3(c) Figure 3(d) Figure 3 shows the directional wind shear (deg), for the MYJ and YSU PBL schemes, under varying soil moisture and geostrophic wind. This is for the nighttime period of the second day of simulation. While nighttime values average only around 5°, hourly values often exceed 15°.