Download
1 / 4
40 likes | 128 Views
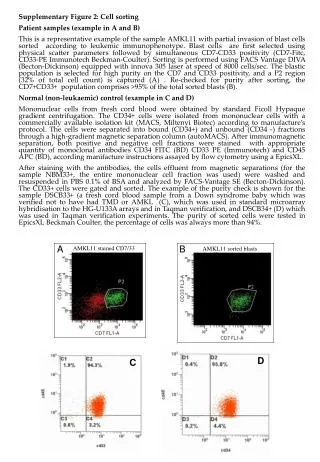
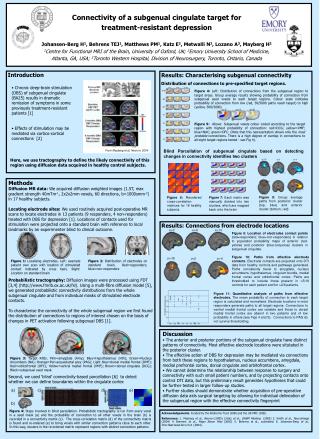
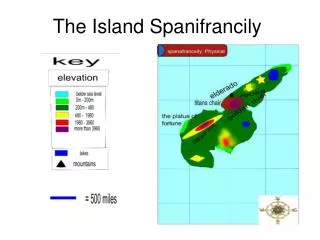
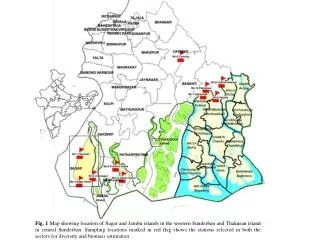
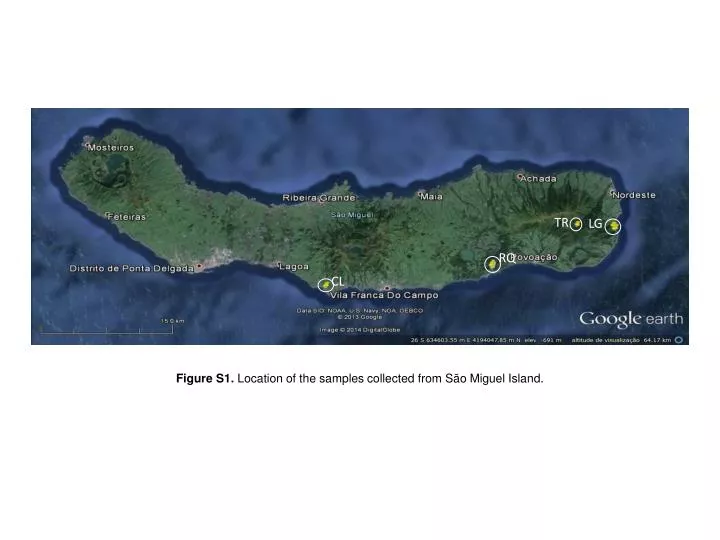
TR. LG. RQ. CL. Figure S1. Location of the samples collected from São Miguel Island. CM. ASR. CD. SA. PD. Figure S2. Location of the samples collected from Pico Island. SER. PB. Figure S3. Location of the samples collected from Terceira Island.

E N D
TR LG RQ CL Figure S1. Location of the samples collected from São Miguel Island.
CM ASR CD SA PD Figure S2. Location of the samples collected from Pico Island.
SER PB Figure S3. Location of the samples collected from Terceira Island.
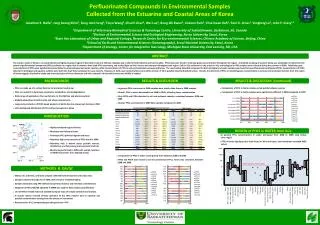
Figure S4. Bayesian clustering performed by STRUCTUREfor a set of 230 P. azoricagenotypes from 11 different populations. (a) ∆K calculated as ∆K = m|L′′(K)|/ s[L(K)]; (b) Ln Pr(G|K) values presented as a function of the number of clusters; (c) Graphical presentations of the different samples. Each sample is represented by a single vertical line broken into K colour segments, with lengths proportional to the estimated membership of the inferred cluster. Individuals are grouped into populations. For populations names see table 1.