Download
1 / 12
120 likes | 239 Views
Section 1.1. The Structure of Data. Why Statistics?. Statistics is all about DATA Collecting DATA Describing DATA – summarizing, visualizing Analyzing DATA

E N D
Section 1.1 The Structure of Data
Why Statistics? • Statistics is all about DATA • Collecting DATA • Describing DATA – summarizing, visualizing • Analyzing DATA • Data are everywhere! Regardless of your field, interests, lifestyle, etc., you will almost definitely have to make decisions based on data, or evaluate decisions someone else has made based on data
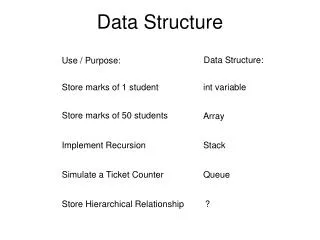
Data • Data is a set of measurements taken on a set of individual units • Usually data is stored and presented in a dataset, comprised of variables measured on cases
Cases and Variables We obtain information about cases or units. A variable is any characteristic that is recorded for each case. • Generally each case makes up a row in a dataset, and each variable makes up a column
Categorical versus Quantitative A categoricalvariable divides the cases into groups A quantitativevariable measures a numerical quantity for each case • Variables are classified as either categorical or quantitative:
Categorical and Quantitative Classify each of the following variables from the StudentSurvey data as either categorical or quantitative: Year in School Gender HigherSAT (which is higher – Math or Verbal?) SAT score GPA # of siblings Height Weight Exercise Hours of TV per week Pulse rate Award preference (Olympic Gold, Academy Award, or Nobel Prize?)
Categorical Quantitative
Explanatory and Response If we are using one variable to help us understand or predict values of another variable, we call the former the explanatory variable and the latter the response variable Examples: • Does meditation help reduce stress? • Does sugar consumption increase hyperactivity?
Variables For each of the following situations: • Which is the explanatory and which is the response variable? • Can eating a yogurt a day cause you to lose weight? • Do males find females more attractive if they wear red? • Does louder music cause people to drink more beer? • Are lions more likely to attack after a full moon?
Summary • Data are everywhere, and pertain to a wide variety of topics • A dataset is usually comprised of variables measured on cases • Variables are either categorical or quantitative • Data can be used to provide information about essentially anything we are interested in and want to collect data on!