Download
1 / 16
160 likes | 297 Views
建立地震預警的多重指標. 陳界 宏、汪中和、溫士忠、 葉 大綱、劉正彥、顏宏元. 2011 年上半年,全球天然災害造成的經濟 損失達 2650 億 美元, 創下史上新高紀錄 。. 上排為臺灣北部宜蘭地區地震 (2008 年 6 月 1 日, 121.790°E, 24.861°N, M=5.8) 的應力變化分佈圖。下排為臺灣中部名間地區 (2009 年 11 月 5 日, 120.719°E, 23.789°N, M=6.2) 的地震應力變化分佈圖。. 12 個範例地震之地殼位移方向差之均值與震央距之關聯性。縱軸表示 GPS 位移方向差之均值的倒數,橫軸表示震央距。.

E N D
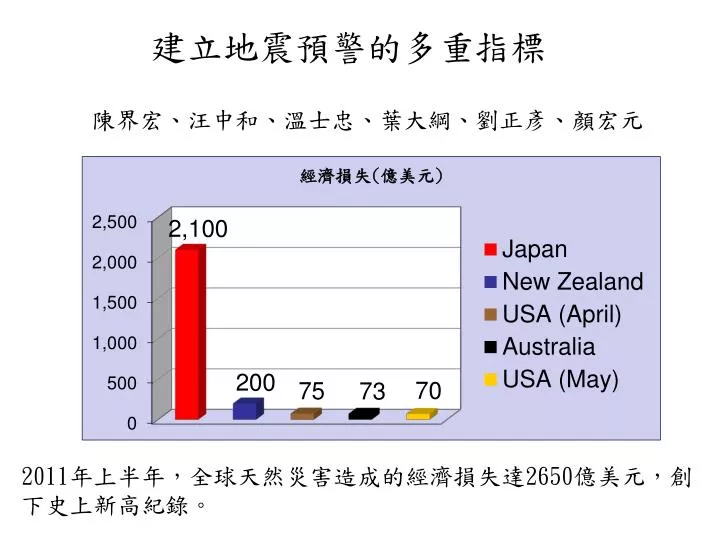
建立地震預警的多重指標 陳界宏、汪中和、溫士忠、葉大綱、劉正彥、顏宏元 2011年上半年,全球天然災害造成的經濟損失達2650億美元,創下史上新高紀錄。
上排為臺灣北部宜蘭地區地震(2008年6月1日, 121.790°E, 24.861°N, M=5.8)的應力變化分佈圖。下排為臺灣中部名間地區(2009年11月5日,120.719°E, 23.789°N, M=6.2)的地震應力變化分佈圖。
12個範例地震之地殼位移方向差之均值與震央距之關聯性。縱軸表示GPS位移方向差之均值的倒數,橫軸表示震央距。12個範例地震之地殼位移方向差之均值與震央距之關聯性。縱軸表示GPS位移方向差之均值的倒數,橫軸表示震央距。
65days 54days 地殼變形前兆提前時間與地震震級之關係。黑實圈表示2006-2009年間臺灣監測到的有地形變前兆的20個地震、以及1999年集集地震(▲)。
季節變化幅度 水位下降期 震前5-7日水位停滯或小降期 水位上升期
名間 甲仙 ? HH HR ? ? HT TH ?
Summarization Geomagnetic anomalies FK、SVD、Daily ratio Surface deformations GPS-azimuths Groundwater level Groundwater level anomalies 2 years 1 year 2 months Few days EQ


![2011 ITRS Emerging Research Materials [ERM] July 10-13, 2011](https://cdn2.slideserve.com/4220097/2011-itrs-emerging-research-materials-erm-july-10-13-2011-dt.jpg)