Download
1 / 40
400 likes | 584 Views
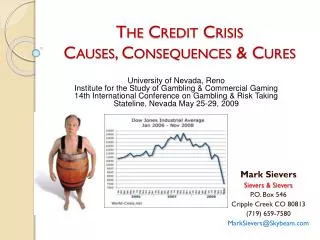
Trends in the Used Vehicle Market – Causes & Consequences. ACVL Webinar 2/10/11. Manheim Used Vehicle Value Index. January 1995 = 100. Source: Manheim Consulting. Concept:.

E N D
Trends in the Used Vehicle Market –Causes & Consequences ACVL Webinar 2/10/11
Manheim Used Vehicle Value Index January 1995 = 100 Source: Manheim Consulting
Concept: A single measure of used vehicle price change that is independent of underlying shifts in the characteristics of vehicles being sold Manheim Used Vehicle Value Index • All Manheim U.S. sales (5+ million annually) • Classify by market segment • Account for shifts in mileage • Weight to provide unchanging mix • Seasonally adjust Steps:
Manheim IndexSample Distribution by Market Class Source: Manheim Consulting
Luxury Vehicles as % ofTotal Auction Sales Source: Manheim Consulting
Percent Distribution of Auction SalesBy Model Year Source: Manheim Consulting
Average Mileage - Compact Cars Sold at Auction Source: Manheim Consulting
Average Auction Price –Fullsize SUVs Source: Manheim Consulting
Price Changes for Selective Market Classes Annual Average % Change, 2009 - 2010 Source: Manheim Consulting
Manheim Used Vehicle Value Index –Annual Average Percent Change Source: Manheim Consulting
New Vehicle CPI1982-1984 = 100 Source: Bureau of Labor Statistics
Year-over-Year Percent Change inNew Vehicle CPI Source: Bureau of Labor Statistics
Dollar Change Over 3 ½ Years inNew Vehicle CPI and Manheim Index Source: Bureau of Labor Statistics & Manheim Consulting
Manheim Index versus Mix & Quality AdjustedNew Vehicle Price 3 ½ Years Prior Source: Bureau of Labor Statistics & Manheim Consulting
Rental: Stability Ahead • New vehicle sales into rental stabilizing at “new normal”. • Shift from program cars to risk units is completed. • Increased service life for risk units has leveled off. • Off-rental prices will show stability at current high base.
New Vehicle Sales Into Rental &Rental Fleet Size Source: Bobit Business Media
Distribution of New Vehicle Sales into Rental - Program versus Risk Source: Bobit Business Media & Manheim Consulting
Average Mileage – Rental Risk Units Source: Manheim Consulting
Average Auction Price – Rental Risk Units Source: Manheim Consulting
Lease Originations - Millions of Units Source: Manheim Consulting Leasing:Growth in Originations & Satisfaction
Lease Penetration Ratesby Manufacturer Source: J.D. Power and Associates
GMAC Sales Proceeds as % of ALG – U.S. Lease Terminations Source: Ally
Off-Lease Volumes – Another Down Cycle Ahead Source: Manheim Consulting
Number of Repossessions - Millions of Units Source: Manheim Consulting Repossessions:Lower Volumes & Older Units
Dealer Consigned Vehicles Sold at NAAA Member Auctions Source: 1999-2009 NAAA Surveys, 20010-2015 Manheim Consulting estimate Dealer Consignment:Steady Growth Ahead
New Car & Light-Duty Truck Sales Seasonally Adjusted Annual Rate - 3-Month Moving Average Source: Automotive News
Used Vehicle Production New Vehicle Sales:A long-term perspective New Car & Light-Duty Truck Sales millions of units Source: Automotive News
Vehicles in Operation from 2 & 3 Model Years Past (in millions of units)
Used Vehicle Retail Sales Source: CNW Marketing Research
Ratio of Used Vehicles Retailedto New Vehicles Retailed Source: Automotive News & CNW Marketing Research
Certified Pre-Owned Sales In Millions Source: Automotive News
% Change Used Units Retailed – Same Store Basis (Publicly-traded Dealership Groups) Weighted average for KMX *, AN, PAG, SAH, GPI, ABG, and LAD *KMX shifted forward one month to correspond with calendar quarter Source: Company filings
Monthly Change In Nonfarm Payrolls3-month moving average – in thousands Source: Bureau of Labor Statistics
Retail Sales Recover from Summer Slowdown Retail Sales, excluding motor vehicles - Monthly Percent Change - Seasonally Adjusted Source: U.S. Department of Commerce
Savings Rate Rises Personal Savings as % of Disposable Personal Income Source: Bureau of Economic Analysis
Personal Income & Wages and Salaries Year-over-year percent change based on 3-month moving average Source: Bureau of Economic Analysis
Household net worth risesin third quarter of 2010 Percent Change from Previous Quarter Source: Federal Reserve Board
Household net worth recovers, but remains $11 trillion below its peak. Household Net Worth – In Trillions
Outlook and Implications • New vehicle sales • A lower underlying trend • Movements around that trend driven by labor market and credit conditions • Manufacturers maintain inventory and pricing discipline • Retail sales and profits continue to shift in favor of used vehicles • Less supply and stable demand means strong used vehicle pricing • Economic recovery may surprise to the upside in the near-term, but we will fail to achieve previous peaks in employment, household net worth, and new vehicle sales prior to the next recession.