Download

1 / 33
340 likes | 536 Views
The Unified Modeling Language Part I. Omar Meqdadi SE 2730 Lecture 6 Department of Computer Science and Software Engineering University of Wisconsin-Platteville. Topics covered. Introduction to UML Overview and Background Modeling Requirements Use Cases Scenarios. Objectives of UML.

E N D
The Unified Modeling LanguagePart I Omar Meqdadi SE 2730 Lecture 6 Department of Computer Science and Software Engineering University of Wisconsin-Platteville
Topics covered • Introduction to UML • Overview and Background • Modeling Requirements • Use Cases • Scenarios
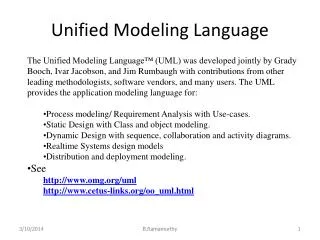
Objectives of UML • UML is a general purpose notation that is used to • visualize, • specify, • construct, and • document the artifacts of a software systems.
Background • UML is the result of an effort to simplify and consolidate the large number of OO development methods and notations • Main groups: Booch [91], Rumbaugh [91], Jacobson [92] • Object Management Group – www.omg.org
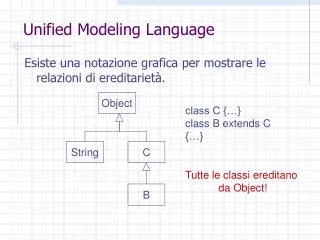
Types of Diagrams • Structural Diagrams – focus on static aspects of the software system • Class, Object, Component, Deployment • Behavioral Diagrams – focus on dynamic aspects of the software system • Use-case, Interaction, State Chart, Activity
Structural Diagrams • Class Diagram – set of classes and their relationships. Describes interface to the class (set of operations describing services) • Object Diagram – set of objects (class instances) and their relationships • Component Diagram – logical groupings of elements and their relationships • Deployment Diagram - set of computational resources (nodes) that host each component.
Behavioral Diagram • Use Case Diagram – high-level behaviors of the system, user goals, external entities: actors • Sequence Diagram – focus on time ordering of messages • Collaboration Diagram – focus on structural organization of objects and messages • State Chart Diagram – event driven state changes of system • Activity Diagram – flow of control between activities
Analysis & Design Process • Requirements elicitation – High level capture of user/system requirements • Use Case Diagram • Identify major objects and relationships • Object and class diagrams • Create scenarios of usage • Class, Sequence and Collaboration diagrams • Generalize scenarios to describe behavior • Class, State and Activity Diagrams • Refine and add implementation details • Component and Deployment Diagrams
UML Driven Process Model
Work Products • Functional Model – Use Case diagrams • Analysis Object Model – simple object/class diagram • Dynamic Model – State and Sequence diagrams • Object Design Model – Class diagrams • Implementation Model – Deployment, and Activity diagrams
Use Case Diagrams • Describes a set of sequences. • Each sequence represents the interactions of things outside the system (actors) with the system itself (and key abstractions) • Use cases represent the functional requirements of the system (non-functional requirements must be given elsewhere)
Use case • Each use case has a descriptive name • Describes what a system does but not how it does it. • Use case names must be unique within a given package • Examples: withdraw money, process loan
Actor • Actors have a name • An actor is a set of roles that users of use cases play when interacting with the system • They are external entities • They may be external an system or DB • Examples: Customer, Loan officer
What is a Use Case • Use case captures some user-visible functionality • Granularity of functionality depends on the level of detail in your model • Each use case achieves a discrete goal for the user • Use Cases are generated through requirements elicitation
Goals vs. Interaction • Goals – something the user wants to achieve • Format a document • Ensure consistent formatting of two documents • Interaction – things the user does to achieve the goal • Define a style • Change a style • Copy a style from one doc to the next
Developing Use Cases • Understand what the system must do – capture the goals • Understand how the user must interact to achieve the goals – capture user interactions • Identify sequences of user interactions • Start with goals and refine into interactions
Refining Use Cases • Separate internal and external issues • Describe flow of events in text, clearly enough for customer to understand • Main flow of events • Exceptional flow of events • Show common behaviors with includes • Describe extensions and exceptions with extends
Use Case – Buy Item • Actors: Customer (initiator), Cashier • Type: Primary • Description: The costumer arrives at the checkout with items to purchase. Cashier records purchases and collects payment. Customer leaves with items
Example: Weather Monitoring Station • This system shall provide automatic monitoring of various weather conditions. Specifically, it must measure: • wind speed and direction • temperature • barometric pressure • humidity • The system shall also proved the following derived measurements: • wind chill • dew point temperature • temperature trend • barometric pressure trend
Weather Monitoring System Requirements • The system shall have the means of determining the current time and date so that it can report the highest and lowest values for any of the four primary measurements during the previous 24 hour period. • The system shall have a display that continuously indicates all eight primary and derived measurements, as well as current time and date. • Through he use of a keypad the user may direct the system to display the 24 hour low or high of any one primary measurement, with the time of the reported value. • The system shall allow the user to calibrate its sensors against known values, and set the current time and date.
Hardware Requirements • Use a single board computer (486?) • Time and date are supplied by an on-board clock accessible via memory mapped I/O • Temperature, barometric pressure, and humidity are measured by on board circuits with remote sensors. • Wind direction and speed are measure from a boom encompassing a wind vane (16 directions) and cups (which advance a counter every revolution) • User input is provided through an off the shelf keypad, managed by onboard circuit supplying audible feed back for each key press. • Display is off the self LCD with a simple set of graphics primitives. • An onboard timer interrupts the computer every 1/60 second.
Display and Keypad • LCDDisplay – Values and current system state (Running, Calibrating, Selecting, Mode) • Operations: drawtext, drawline, drawcircle, settextsize, settextstyle, setpensize • Keypad allows user input and interaction • Operations: last key pressed • Attributes: key N Date: Time: Temp: Pressure: Humidity: Temp Hum Press Wind Time Date W E Select Cal Mode S
Scenario: Powering Up • Power is turned on • Each sensor is constructed • User input buffer is initialized • Static elements of display are drawn • Sampling of sensors is initialized The past high/low values of each primary measurement is set to the value and time of their first sample. The temperature and Pressure trends are flat. The input manager is in the Running state
Scenario: Setting Time and Date • User presses Select key • System displays selecting • User presses any one of the keys Time or Date. Any other key is ignored except Run • System flashes the corresponding label • Users presses Up or Down to change date or time. • Control passes back to step 3 or 5 User may press Run to abandon the operation.
Scenario: Display highest and lowest • User presses Select key • System displays selecting • User presses any one of the keys (Wind, Temp, Humidity, Pressure). Any other key is ignored except Run • System flashes the corresponding label • Users presses Up or Down to select display of highest or lowest in 24 hour period. Any other key press is ignored except for Run • System displays value with time of occurrence • Control passes back to step 3 or 5 User may press Run to abandon the operation.
Summary • A well structured use case: • Names a single identifiable and reasonably atomic behavior of the system • Factors common behavior by pulling such behavior from other use cases that include it • Factors variants by pushing such behavior into other uses cases that extend it • Describes events clearly • Described in a minimal set of scenarios