Download
1 / 41
430 likes | 613 Views
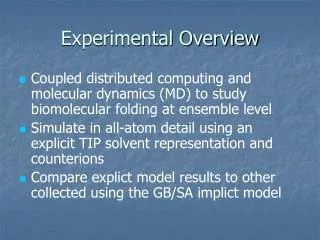
Experimental evolution. The outcome of selection for high and low oil content in the Illinois corn experiment. William Dallinger 1880-1886 Selected for thermotolerance of microorganisms 60 F 158 F. How experimental evolution works. Batch (serial) culture Chemostat Turbidostat

E N D
The outcome of selection for high and low oil content in the Illinois corn experiment.
William Dallinger 1880-1886 Selected for thermotolerance of microorganisms 60 F 158 F
How experimental evolution works • Batch (serial) culture • Chemostat • Turbidostat • Static culture (liquid or solid)
What are the key variables? (brainstorm) • Population size (N), and effective population size (Ne) • Mutation rate • Recombination? • Parasites? • Constant or fluctuating environment? • Mass-action or structured environment?
Some questions addressed by experimental evolution • What is the tempo and mode of evolution? (gradual or punctuated, limits, etc?) • What factors promote or constrain adaptation? • What are the consequences of adaptation? • What are the mechanisms of adaptation? • Is the mutation rate optimal or minimal? • How do mutations interact?
Is evolution repeatable? “I call this experiment ‘replaying life’s tape.’ You press the rewind button and, making sure you thoroughly erase everything that actually happened, go back to any time and place in the past – say to the seas of the Burgess Shale. Then let the tape run again and see if the repetition looks at all like the original.” “The bad news is that we cannot possibly perform the experiment…” -S.J. Gould, Wonderful Life: the Burgess Shale and the nature of history (1989)
We CAN replay evolution Replicate populations evolving under identical conditions address whether evolution is repeatable. Do you predict phenotypic repeatability (parallelism)? Do you predict genetic repeatability?
Some more questions • Why has sex evolved? • Why do we age? • How does virulence evolve? • How does cooperation (or cheating) evolve? • How does speciation begin? • Is evolution Wrightian (many different outcomes) or Fisherian (one universal solution)? • How do competitors coexist?
The most conspicuous evidence of evolution by natural selection is the fit of organisms to their environment. Yet quantifying adaptation continues to elude biologists.
Fitness = Ln [ N 1 (Day 1) / N1 (Day 0) ] Ln [ N 2 (Day 1) / N2 (Day 0) ] Adaptation may be quantified directly Day 0 Day 1 Evolved Ancestor Determine 1 :2 Plate on agar to determine the ratio of 1 :2
- + Generation 0 ------------------------- Generation 20,000+ è • Experimental • Conditions • 12 replicate cultures • single genotype of Escherichia coli B • daily serial transfer • single resource and temperature • no sex
Mutation rate itself evolves in certain populations Non-mutator Mutator Population Generations Sniegowski et al., Nature 387, 703-705 (1997)
“Part of the folk wisdom of evolutionary biology is that specialization leads to adaptive decay for environments outside the domain of specialization.”-R.D. Holt, Evol. Ecol. (1996)
Q1: Is the “folk wisdom” true? • Does specialization lead to adaptive decay? (Can we find such an association?) • Specialization: adaptation by an organism to a subset of its original environment • Adaptive decay: decay in niche breadth that is associated with adaptation
Why is this association so elusive? • To determine if specialization leads to adaptive decay, we need to: • quantify adaptation • know the history of adaptation • Both have proven challenging in most natural and experimental systems.
Important environmental factors Glucose 37° C
· · · Fitness I used Biolog plates to measure diet breadth Time (Generations)
Hypothetical curves describing loss of function: Total Catabolic Function Time (Generations)
? ancestors evolved Parallel and convergent changes across lineages are hallmarks of adaptive evolution
Diet breadth decays over time Red = mutators White = non-mutators Total Catabolic Function 0 2,000 10,000 20,000 Time (Generations) Cooper and Lenski (2000) Nature 407:736-739.
Specialization in diet breadth was caused mostly by antagonistic pleiotropy • Antagonistic pleiotropy: • Most losses of catabolic function occurred in replicate populations (parallelism) and when adaptation was most rapid (early in the experiment). • Mutation accumulation: • Mutator populations tend to lose more catabolic functionality… • …but this additional loss is not proportional to the increase in mutation rate.
Evolution of thermal niche Generation time Vmax Temperature (°C) Cooper, Bennett, and Lenski. (2001) Evolution 55(5):889-896.
Adaptation to moderate temperatures leads to reduced performance at extreme temperatures Relative Vmax Time (Generations) Cooper, Bennett, and Lenski. (2001) Evolution 55(5):889-896.
Case study: What explains the rapid loss of D-ribose catabolism? Frequency Rbs- Time (Generations) Cooper, V. S., D. Schneider, M. Blot, and R. E. Lenski. (2001) J. Bact. 183: 2834–2841.
Ribose function is hypermutable • Mutation rate for ribose loss = 5.4 X 10⁻⁵ per generation. • 2-5 orders of magnitude higher than mutation rates measured for other traits. • Time required to reach a frequency of 50% under mutation pressure alone = 18,519 generations.
A. IS150 G6 G5 G267 G268 G76 rbsD rbsA rbsC rbsB rbsK rbsR yieO left IS150 G266 adjacent sequence G269 G77 right IS150 adjacent sequence HincII HincII HincII HincII HincII HincII B. Hyb. PCR Extent of the deletion (bp ) (bp ) Ara-1 2,812 2,071 Ara-2 3,043 2,302 Ara-3 3,854 7,373 Ara-4 3,338 2,597 Ara-5 2,483 3,378 Ara-6 3,034 2,293 Ara+1 1,972 2,867 Ara+3 3,332 2,591 Ara+4 4,163 5,058 Ara+5 2,999 3,894 Ara+6 3,329 2,588 2,662 9,005 Ancestor 1 k b Cooper, V. S., D. Schneider, M. Blot, and R. E. Lenski. (2001) J. Bact. 183: 2834–2841.
1.05 1.04 1.03 1.02 l l l l l l 1.01 l 1 0.99 0.98 1 2 3 4 5 6 7 Rbs- mutation alone improves fitness Fitness Independent Rbs-mutants of ancestor
What accounts for the rapid loss of ribose catabolism? Time to 50% of population • MA alone = 18,519 generations • Selection = 1,774 generations • Selection plus MA = 781 generations • Genetic hitchhiking = priceless (< 500 generations)
Loss of succinate, fumarate, malate function • suite of functions compromised in part by IS insertion in pykF • different pykF mutations found in other populations; same reversibility? • suggests selection to regain succinate function and study of evolution of phenotypic plasticity
Summary • Is specialization caused more by AP or MA? • Antagonistic pleiotropy explains the majority of change in diet breadth and thermal range. • Mutation accumulation is only detectable among mutator populations; may require more time? • Should adaptive decay be “folk wisdom?” • Most functions were retained. • Selection in permissive environments may yield a greater frequency of specialists. • The mechanisms responsible for loss of function cannot be assumed.