Download
1 / 38
380 likes | 478 Views
You have data! What ’ s next? Data Analysis, Your Research Questions, and Proposal Writing Zoo 511 Spring 2014. Part 1: Research Questions. Part 1: Research Questions.

E N D
You have data! What’s next? Data Analysis, Your Research Questions, and Proposal Writing Zoo 511 Spring 2014
Part 1: Research Questions Write down > 2 things you thought were interesting or engaging during the field trip (can be a species, a habitat feature, a relationship, etc). You can phrase these as questions, but you don’t have to yet.
Part 1: Research Questions What makes a good question?
Your questions should be specific and answerable NOT SO USEFUL USEFUL What habitat do fish prefer? Does sculpin CPUE differ among geomorphic units? In what kind of stream are brown trout most likely to be found? Is brown trout density related to flow velocity?
Brown Trout/m2 Current Velocity (m/s) …and statistically testable Does sculpin CPUE differ among geomorphic units? Is brown trout density related to flow velocity? Sculpin CPUE RIFFLE RUN POOL
Part 2: StatisticsHow do we find the answer to our question?
Why use statistics? Are there more green sunfish in pools or runs? Run 5 4 1 Pool 2 7 3 12 ?? 10 • Statistics help us find patterns in the face of variation, and draw inferences beyond our sample sites • Statistics help us tell our story; they are not the story in themselves!
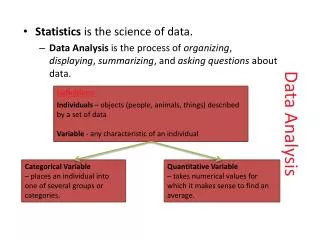
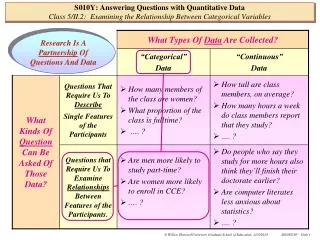
Statistics Vocab (take notes on your worksheet) Categorical Variable: Discrete groups, such as Type of Reach (Riffle, Run, Pool) Continuous Variable: Measurements along a continuum, such as Flow Velocity What type of variable is “Mottled Sculpin /meter2”? What type of variable is “Substrate Type”?
Statistics Vocab Explanatory/Predictor Variable: Independent variable. On x-axis. The variable you use to predict another variable. Response Variable: Dependent variable. On y-axis. The variable that is hypothesized to depend on/be predicted by the explanatory variable.
Statistics Vocab Mean: The most likely value of a random variable or set of observations if data are normally distributed (the average) Variance: A measure of how far the observed values differ from the expected variables (Standard deviation is the square root of variance). Normal distribution: a symmetrical probability distribution described by a mean and variance. An assumption of many standard statistical tests. N~(μ1,σ2) N~(μ2,σ2) N~(μ1,σ1)
Statistics Vocab Hypothesis Testing: In statistics, we are always testing a Null Hypothesis (Ho) against an alternate hypothesis (Ha). p-value:The probability of observing our data or more extreme data assuming the null hypothesis is correct Statistical Significance: We reject the null hypothesis if the p-value is below a set value (α), usually 0.05.
What test do you need? For our data, the response variable will probably be continuous. T-test: A categorical explanatory variable with only 2 options. ANOVA: A categorical explanatory variable with >2 options. Regression: A continuous explanatory variable
Student’s T-Test Tests the statistical significance of the difference between means from two independent samples Null hypothesis: No difference between means.
Compares the means of 2 samples of a categorical variable p = 0.09 Mottled Sculpin/m2 Cross Plains Salmo Pond
Analysis of Variance (ANOVA) Tests the statistical significance of the difference between means from two or more independent groups p = 0.03 Mottled Sculpin/m2 Riffle Pool Run Null hypothesis: No difference between means
Precautions and Limitations • Meet Assumptions • Samples are independent • Assumed equal variance (this assumption can be relaxed) Variance not equal sculpin density in pools sculpin density in runs
Precautions and Limitations • Meet Assumptions • Samples are independent • Assumed equal variance (this assumption can be relaxed) • Observations from data with a normal distribution (test with histogram)
Precautions and Limitations • Meet Assumptions • Samples are independent • Assumed equal variance (this assumption can be relaxed) • Observations from data with a normal distribution (test with histogram) • No other sample biases
Simple Linear Regression • Analyzes relationship between two continuous variables: predictor and response • Null hypothesis: there is no relationship (slope=0)
Residuals Residuals are the distances from observed points to the best-fit line Residuals always sum to zero Regression chooses the best-fit line to minimize the sum of square-residuals. It is called the Least Squares Line.
Precautions and Limitations • Meet Assumptions • Relationship is linear (not exponential, quadratic, etc) • X is measured without error • Y values are measured independently • Normal distribution of residuals
0 Residual Plots Can Help Test Assumptions 0 “Normal” Scatter Curve (linearity) Fan Shape: Unequal Variance 0
if assumptions are violated • Try transforming data (log transformation, square root transformation) • Most of these tests are robust to violations of assumptions of normality and equal variance (only be concerned if obvious problems exist) • Diagnostics (residual plots, histograms) should NOT be reported in your paper. Stating that assumptions were tested is sufficient.
Precautions and Limitations • Meet Assumptions • Relationship is linear (not exponential, quadratic, etc) • X is measured without error • Y values are measured independently • Normal distribution of residuals • Interpret the p-value and R-squared value
P-value: probability of observing your data (or more extreme data) if no relationship existed - Indicates the strength of the relationship, tells you if your slope (i.e. relationship) is non-zero (i.e. real) R-Squared: indicates how much variance in the response variable is explained by the explanatory variable -Does not indicate significance
R-Squared and P-value High R-Squared Low p-value (significant relationship)
R-Squared and P-value Low R-Squared Low p-value (significant relationship)
R-Squared and P-value High R-Squared High p-value (NO significant relationship)
R-Squared and P-value Low R-Squared High p-value (No significant relationship)
We just talked about: • Types of variables • 3 statistical tests: t-test, ANOVA, linear regression • When to use these tests • How to interpret the test statistics • How to be sure you’re meeting assumptions of the tests
Writing a Proposal • What is the function of a proposal? • To get money
Writing a Proposal • What is the function of a proposal? • What information should go in a proposal? • Research goals/objectives/hypotheses/questions • Why does this matter? (Rationale) • Procedure / Methods • Future directions / implications • Budget/cost analysis • Expected results
Other data you can use Previous years’ data on website: all of the same information was collected from the same place, around the same time of year. Replication! USGS: http://waterdata.usgs.gov/nwis/uv?05435943 Background info: from the Upper Sugar River Watershed Association Think about these data sources as you generate your questions.