Download
1 / 39
420 likes | 743 Views
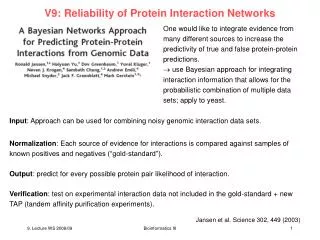
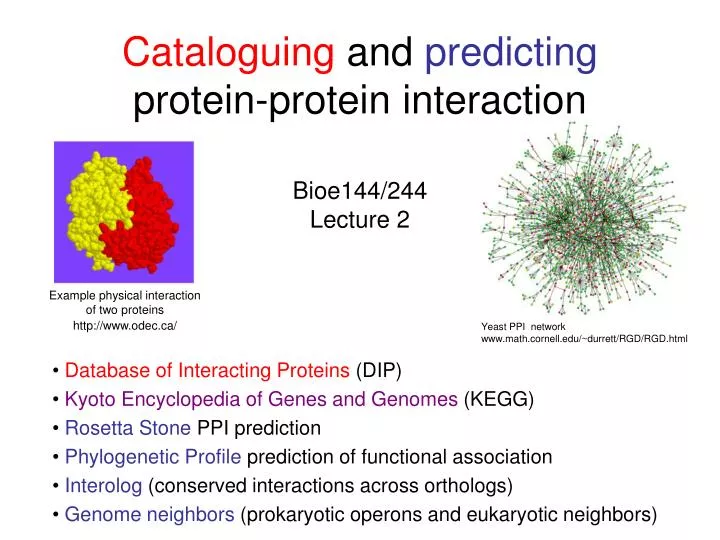
Example physical interaction of two proteins http://www.odec.ca/. Yeast PPI network www.math.cornell.edu/~durrett/RGD/RGD.html. Cataloguing and predicting protein-protein interaction Bioe144/244 Lecture 2. Database of Interacting Proteins (DIP)

E N D
Example physical interaction of two proteins http://www.odec.ca/ Yeast PPI network www.math.cornell.edu/~durrett/RGD/RGD.html Cataloguing and predicting protein-protein interactionBioe144/244Lecture 2 Database of Interacting Proteins (DIP) Kyoto Encyclopedia of Genes and Genomes (KEGG) Rosetta Stone PPI prediction Phylogenetic Profile prediction of functional association Interolog (conserved interactions across orthologs) Genome neighbors (prokaryotic operons and eukaryotic neighbors)
Reading for this lecture • Required: • “Protein function in the post-genomic era”, Eisenberg, Marcotte, Xenarios & Yeates, Nature 2000 • Recommended: • “Principles of protein-protein interactions”, Jones & Thornton, PNAS 1996 vol. 93 no. 1 13-20 • “Deciphering Protein–Protein Interactions. Part I. Experimental Techniques and Databases”, Shoemaker & Panchenko, PLoS Computational Biology 2007 • “Deciphering Protein–Protein Interactions. Part II. Computational Methods to Predict Protein and Domain Interaction Partners”. Shoemaker & Panchenko PLoS Comput Biol 2007
Bioinformatics resources referenced in this lecture • Enzyme Commission: http://www.chem.qmul.ac.uk/iubmb/enzyme/ • KEGG: http://www.genome.jp/kegg/kegg2.html • STRING: http://string.embl.de/ • PHOG Interactome: http://phylofacts.berkeley.edu/phog/net/ • Database of Interacting Proteins: http://dip.doe-mbi.ucla.edu/dip/
Terminology • A “network” usually refers to all the interactions in an organism (e.g., “the yeast network”) • This can refer to physical interactions, participation in a metabolic network, or genetic interactions (e.g., gene X regulates the expression of gene Y) • A “pathway” usually refers to a specific series of interactions, e.g. • direct physical interactions (e.g., a signalling pathway) or • indirect, by passing the product of one enzyme to be the substrate for another enzyme (i.e., a metabolic pathway) • Genetic regulation • Protein-protein interactions can be transitory or more long-lasting (as in complex formation). • A “biological process” is a more amorphous term, and very little may be known about the connectivity. For example, plant proteins can be said to participate in pathogen defense, even if the exact connections they make are known. The Gene Ontology (GO) includes terms for different biological processes.
http://en.wikipedia.org/wiki/Gene_regulatory_network Image from: http://genomics.energy.gov
Example metabolic pathwayKEGG Glycolysis pathway (human) • Edges in graph are enzymes indicated by their EC (Enzyme commission) numbers. Edges are directed, indicating dependency on a previous step. • Nodes in the graph correspond to inputs to enzymes (enzyme substrates), which may be the products of previous steps in the pathway. • Green boxes mean that a gene has been identified for that role (usually computationally) http://www.genome.jp/kegg/pathway/map/map00010.html
Example signaling pathwayKEGG Human toll-like receptor pathways(subset shown) In signaling pathways, nodes indicate proteins, and edges indicate interaction between proteins. Edges are directed. http://www.genome.jp/kegg/pathway/hsa/hsa04620.html
KEGG Asthma Pathway (human) http://www.genome.jp/kegg/pathway/hsa/hsa05310.html
KEGG: Bacterial secretion systems Note that KEGG models for pathways may not be entirely up to date. See, e.g., Zambryski revised model, shown in PNAS
Principles of protein-protein interactions, Jones and Thornton, PNAS 1996 vol. 93 no. 1 13-20strongly recommended
“Deciphering Protein–Protein Interactions. Part I. Experimental Techniques and Databases”, PLoS Computational Biology 2007.
Xenarios et al 2002, Nucleic Acids Research http://dip.doe-mbi.ucla.edu
“One intrinsic caveat of the yeast two-hybrid system is the potential detection of spurious interactions that bear no biological significance.” Walhout, Bouton and Vidal “Yeast two-hybrid systems and protein interaction mapping projects for yeast and worm” Yeast 2000
Prediction methods • Interologs (aka interlog): conserved interactions between orthologous pairs • Phylogenetic profile: groups of genes inherited together, indicating functional linkages • Rosetta Stone: fused genes in one organism indicating interaction in another (where the genes are separate) • Genome neighbors: nearby on a genome, indicating possible correlated regulation • Text-mining: co-occurrence in the same abstract or paper • Expression data: correlated expression patterns • not covered in this class, since we focus on proteins
BR BS Interologs: conserved interactions across orthologs If AR and BR are two genes interacting in reference species R, and if AS and BS are orthologous genes in species S, then if AS and BS also interact, then we say that there is a “conserved interaction” or “interolog relationship”. AR AS “Identification of Potential Interaction Networks Using Sequence-Based Searches for Conserved Protein-Protein Interactions or “Interologs”” Matthews et al, Genome Research 2001
I. Phylogenetic Profiles Pellegrini, Marcotte, Thompson, Eisenberg and Yeates Assigning protein functions by comparative genome analysis: Protein phylogenetic profiles PNAS, 1999
“Our computational method detects proteins that participate in a common structural complex or metabolic pathway. Proteins within these groups are defined as functionally linked. The underlying hypothesis is that functionally linked proteins evolve in a correlated fashion, and, therefore, they have homologs in the same subset of organisms… In general, pairs of functionally linked proteins have no amino acid sequence similarity with each other, and, therefore, cannot be linked by conventional sequence-alignment techniques.” Pellegrini et al, PNAS, 1999
What is a phylogenetic profile? • A matrix with m rows and n columns; • m= #genes, and n= #species • M[i,j] = 1 if gene i is present in genome j 0 else Standard clustering techniques can then be applied to the rows of the matrix Genes that have similar phylogenetic profiles are believed to be functionally related (although they may not be homologous)
Question: How do they decide if a gene is present? Answer: They use simple pairwise sequence comparison (e.g., BLAST) Question: What are the possible problems with this approach? (Discuss in class)
Limitations • “With the 16 currently available fully sequenced genomes, phylogenetic profiles are not able to separate the metabolic pathways of specific amino acids. • Instead…a histidine biosynthesis protein seems to have the same profile as a tryptophan, arginine, and cysteine synthesis protein.”
Trp vs His biosynthesis His biosynthesis enzymes vs Trp: EC 2.4.2.17vs 2.4.2.18 EC 3.6.1.31 EC 3.5.4.19 EC 5.3.1.16vs 5.3.1.24 EC 4.2.1.19 vs 4.2.1.20 EC2.6.1.9 vs 2.6.1.* EC 3.1.3.15 EC 1.1.1.23 vs 1.1.1.25 Tryptophan biosynthesis Histidine biosynthesis
Enzyme Commission4.2.1.19 vs 4.2.1.20 • Note: • Changes in EC numbers • This can cause apparent disagreements in annotation
Enzymes can participate in more than one metabolic pathway(and cross-talk between pathways is common)
Rosetta Stone “Detecting Protein Function and Protein-Protein Interactions from Genome Sequences” Ed Marcotte, Matteo Pellegrini, Ho-Leung Ng, Danny Rice, Todd Yeates and David Eisenberg Science, 1999
“A computational method is proposed for inferring protein interactions from genome sequences on the basis of the observation that some pairs of interacting proteins have homologs in another organism fused into a single protein chain.”
Example Rosetta Stone proteins Experimentally verified Predicted by Rosetta Stone
Promiscuous domains cause problems with Rosetta Stone predictions
Authors acknowledge Rosetta Stone weaknesses • False positive predictions: some proteins may be functionally rather than physically interacting • False negatives: some proteins interact without there being a Rosetta Stone to indicate this interaction • E.g., in the Database of Interacting Proteins (DIP) only 6.4% of interacting pairs have a Rosetta Stone sequence
Rosetta Stone method criticisms “If the mode of interaction of two proteins or two protein domains is known, we might expect that any interactions that occur between their homologues would usually involve contacts of the same kind. However, there are a few cases in which homologous proteins have different modes of interaction…”
“Marcotte et al did not use strict BLAST criterion for determining homology between individual protein domains, but rather used the more distant homologies listed in the PFAM and ProDom protein family databases. This means that they find more putative protein interactions in their survey of interactions… Essentially, this method assumes that, if two domains are seen in one protein, then all domains from those two families are expected to interact with each other. … That this assumption will lead to a large number of false positives is obvious, in so far as the members of two interacting families are likely to have particular specificities for each other, rather than all interact with all members of the other family.
STRING http://string.embl.de/ http://string.embl.de/
http://phylofacts.berkeley.edu/phog/net/ Results are available only for sequences that have already been included in a phylogenetic tree in the PhyloFacts resource Orthologs are based on the PHOG algorithm, described in Datta et al, “Berkeley PHOG: PhyloFacts Orthology Group Prediction Web Server” Nucleic Acids Research 2009.
Summary of Prediction Methods • Non-homology based methods can be used to make predictions of interaction and functional association for protein families • All prediction method are prone to errors of different types (false positives and false negatives), and you should know their specific sources • Phylogenetic profiles attempt to identify groups of genes/proteins that have correlated evolutionary patterns to find functionally associated genes/proteins • Possible source of errors: paralogs instead of orthologs; close taxonomic relationships not properly weighted • Rosetta Stone method attempts to find proteins that may interact based on a fused form in another species • Possible source of errors: paralogs instead of orthologs; functional instead of physical association • Genome neighbors: straightforward in prokaryotes due to operons, not quite as direct an association in eukaryotes • Interolog PPI prediction: Many issues. What data to use as input to the method? How to evaluate? Most experimental data for PPI have many FP and also many FN.
Additional notes • Many prediction resource, including KEGG, PHOG-PPI and STRING make use of homology and other prediction protocols to predict functional linkages or PPI • These predictions should be viewed as hypotheses, not actual experimentally supported interactions • Pathways and interactions observed in one species may not be present in the exact form in other species