Download
1 / 17
180 likes | 341 Views
VALUE STREAM MAPPING WORKSHOPS. Purpose: To restructure the process for designing and permitting California hospitals in order to generate more value for stakeholders and to eliminate waste, anything not needed to generate value. VALUE STREAM MAPPING WORKSHOPS. Desired Outcomes:

E N D
VALUE STREAM MAPPING WORKSHOPS Purpose: • To restructure the process for designing and permitting California hospitals in order to generate more value for stakeholders and to eliminate waste, anything not needed to generate value.
VALUE STREAM MAPPING WORKSHOPS Desired Outcomes: • Agreement to a preliminary value stream map of the current state process • Assigned action items to provide supplementary data to flesh out the current state process map
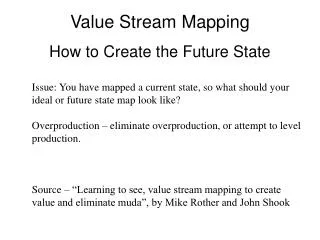
VALUE STREAM MAPPING WORKSHOPS • Thursday Oct 5 • Understanding and documenting goals and expected outcomes • First pass at current state process map • Wednesday Oct 11 • Understanding and benchmarking the current state process, including value added % • Wednesday Oct 18 • Creating a future state process map • Wednesday Nov 1 • Creating an implementation plan • Thursday Nov 16 • Creating standard work
VALUE STREAM MAPPING WORKSHOPS Agenda: • Start up • Value Stream Mapping Basics • Adding Value and Improving Process • Map the current state processes of each owner: CHW, Kaiser, St. Joseph, Sutter • Identify processes to be exploded into greater detail. Generate list of needed information and get commitments to providing it. • Wrap Up
Ground Rules for Current State Mapping • Stay in the current state. We will add detail later. • Avoid war stories. • As future state ideas surface, park them in the parking lot. • Don’t take it, or make it personal. • Treat people with respect. • Practice active listening. • Treat failure and/or breakdown as opportunity
ASSUMPTIONS • 100-bed hospital • adjacent hospital support building, OSHPD 3 • on-site structured parking • design-assist contractors, including major subcontractors, on-board from beginning • produce "drawings" using 3D model • No assumptions about who owns the 3D model (ie. subs vs. engineers) • Use 3D model in different ways for different audiences (ie produce 2D drawings for permit; use by sub to fabricate sheet metal, etc.) • No assumptions about contract relationships are necessary • Contracts with owner are cost plus, with a fixed fee
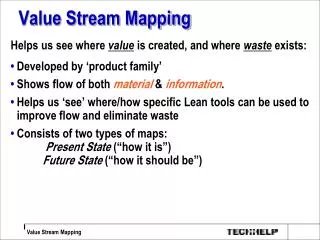
VALUE STREAM MAPPING • What it is • Why do it • How do it
But first… In the process of designing and permitting a hospital, information moves from one party to another. Sometimes the information is used to make decisions or generate designs, but much of the time it sits waiting, or is being inspected, or is being redone.
What are the states in which we can find materials or information in a process? • Undergoing transformation • Being moved • Waiting • Being inspected • Being reworked
Value and Waste Value is that for the sake of which a process exists; e.g., to produce designs that meet customer needs within the constraints of time, money, and regulatory requirements. Waste in a process is anything not needed to get the job done to the satisfaction of the customer and other stakeholders. Only processing adds value. All the rest is waste: • Waiting • Moving • Inspecting or Approving • Reworking
Ohno’s 7 Types of Waste • Inventories of goods awaiting processing or consumption • Unnecessary transport of goods • Defects in products • Overproduction of goods not needed • Unnecessary processing • Waiting by employees for process equipment to finish work or for an upstream activity to complete. • Unnecessary movement of people
Swimlane Diagram of the RFI Process for Placing Drawings © 2005 Z.K. Rybkowski All rights reserved.
RFI Process for Placing Drawings Q? What is the percentage of actual processing time of an RFI compared to the amount of time it sits in someone’s In tray? © 2005 Z.K. Rybkowski and I.D. Tommelein All rights reserved.
Lead time (LT) Time spent to respond to RFIs (VAT) Sample entry: Assumptions: 8 hour work days (weekends not deducted) Sections of RFI log where time spent was not recorded are not included in the calculation. © 2005 Z.K. Rybkowski and I.D. Tommelein All rights reserved.
VALUE STREAM MAPPING Total steps Non-Value adding Non-value adding but necessary Value-adding
Observe and Gather Data • Walk (in your mind) the flow of items and information • gather data, thinking about... Touch Time: Cycle Time: People:
VALUE STREAM MAPPING • What it is—a way of making waste evident in a process • Why do it—to eliminate the waste • How do it—use swimlane diagrams and, for now, show only lane changes, and document touch time, cycle time & people involved in each process step