Download

1 / 31
410 likes | 965 Views
Value Stream Mapping. Learning to See Waste. Everything you do in your Company is accomplished through a process. Process View. Even the smallest activities are accomplished through processes. Order Materials. Issue paychecks. Setup Equipment. What is a process?. Characteristics :.

E N D
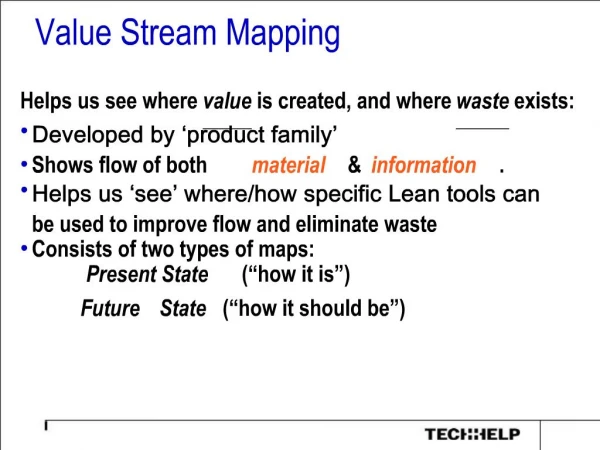
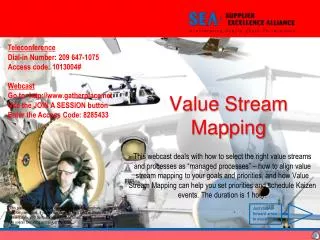
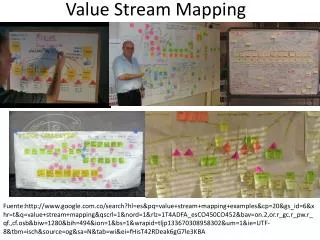
Value Stream Mapping Learning to See Waste
Everything you do in your Company is accomplished through a process. Process View • Even the smallest activities are accomplished through processes. Order Materials Issue paychecks Setup Equipment
What is a process? Characteristics : • Definition : Process: A series of actions or steps toward achieving a particular end.
Waste in Processes Taichi Ohno’s Seven Forms of Process Waste Over Processing Correction Over- Production Inventory TYPES OF WASTE Motion Waiting Material Movement + Underutilization of Employees !!!
Definition: Producing More Than Needed Producing Faster Than Needed Producing Sooner than Needed Waste of Overproduction Some Characteristics Inventory Stockpiles Extra Racks, Containers Building Ahead Long Lead Times Extra / Oversized Equipment Unbalanced Material Flow Excessive Capacity / Investment Safety Concerns • Some Causes Large Batches Poor Communication Long Changeover Time Low Uptimes Lack of Consistent Schedules Forecasts vs. Customer Demand
Definition: Repair of a Product or Service to Fulfill Customer Requirements Waste of Correction Some Characteristics Repair and Rework Areas Increased Inspection Missed Shipments / Deliveries Poor Customer / Supplier Relations Reactive Organization Lost Capacity Scrap Premium Freight Reactive Organization • Some Causes Incapable Processes Incapable Suppliers Insufficient Training Inadequate Tools / Equipment Poor Layouts / Handling Issues Processes Not Under Control High Inventory Levels
Definition: Inconsistent Material Flow. Unnecessary Movement of Parts. Waste of Material Movement Some Causes Large Lot Processing Inconsistent Schedules Long Changeover Times Lack of Work Place Organization Improper Facility Layout Excess Inventory Some Characteristics Multiple Storage Locations Complex Material Flows Wasted Floor Space Large Tanks & Warehouses Inventory Errors Unbalanced Drive Schedule Heavy Duty Barriers & Protection Devices
Definition: Effort Which Adds No Perceived Value to a Product/Customer. Engineering Changes Waste of Overprocessing Excessive approvals Redundant processes Reports with too much information Reports that you don’t use Some Characteristics Bottlenecks Lack Boundary Samples or Clear Customer Specifications Endless Refinement Redundant Approvals Extra Copies / Excessive Information Some Causes Engineering Change w/o Process Change Decision Making at Inappropriate Levels Ineffective Policies & Procedures Lack of Customer Input Concerning Requirements
Definition: Any Supply in Excess of Customer Requirements. Any Supply which is not having value added to it. Waste of (too much) Inventory Some Characteristics FISH instead of FIFO SMOI Long Lead Time for Engineering Changes Off Line Storage Area Extra Material Handling Resources (People, Equipment, Racks, Storage, Tanks, Space / Systems) Slow Response to Customer Demands Low Inventory Turns Some Causes Incapable Processes Uncontrolled Bottlenecks Incapable Suppliers Long Changeover Times Local Optimization Inaccurate Forecasts Sub-optimized Raw Material Ordering Efficiency Measures
Waste of Waiting Definition: • People or parts waiting for a work cycle to be completed. • Idle time resulting when two dependent variables are not fully synchronized. Some Characteristics People Waiting for Machines Machines Waiting for People People Waiting for People Waiting for Materials Unbalanced Operations Lack of Concern for Breakdowns Unplanned Equipment Downtime • Some Causes Inconsistent Work Methods Long Machine Changeover Times Downtime/Breakdowns Poor Machine / People Effectiveness Lack of Proper Machines
Definition: Any movement of people that does not add value to the product or service. 20 ft. 20 ft. 20 ft. Waste of Motion Some Characteristics Looking to Find Tools Walking for Materials Excessive Reaching / Bending Walking Around Things Moving Thing Out of the Way Machines / Material too Far Apart Some Causes Poor Housekeeping Equipment, Office & Plant Layout Lack of Work Place Organization Poor Machine / Operator Effectiveness Inconsistent Work Methods Large Batch Sizes Hint: Don’t confuse motion with work.
Waste in Processes Can you spot examples in your work area? Over Processing Correction Over- Production Inventory TYPES OF WASTE Motion Waiting Material Movement + Underutilization of Employees !!!
Learning to See Wastes Value Stream Mapping: A descriptive analysis that helps you to see and understand the complete flow of material and information towards the final product. “Whenever there is a product for a customer, there is a value stream. The challenge lies in seeing it.” Womack and Jones
Value Stream Mapping Why is Value Stream Analysis so important for Lean Processing? • Supports process thinking. • Takes a big picture view – improve the whole vs optimize individual steps. • Shows the connection of material, people, and information flows. • Standard for management to document the whole process.
Types of VSMs • Single value stream – factory order to ship • Multi-value stream – order to cash • Enterprise value stream – design, sales, order, produce, ship, bill
Process 1 Process 2 Process n Shipping LTS: Start With Physical Flow and Data Customer Supplier Supply-chain data Product- demand data Raw- material shipments Product delivery I I I I Raw-material inventory Raw-material inventory Finished-goods inventory Finished-goods inventory Inventory quantity Inventory quantity Process 1 data Process 2 data Process n data Inventory quantity Inventory quantity
Forecasts Raw-Material Forecasts Raw-material orders Orders Customer Supplier Production schedule Supply-chain data Production schedule Demand- pattern data Production schedule Raw- material shipments Product delivery Production control I I I I Process 1 Process 2 Process n Shipping Raw-material inventory Finished-goods inventory Inventory quantity Inventory quantity Process 1 data Process 2 data Process n data Inventory quantity Inventory quantity LTS: Add Information Flows VA VA VA VA NVA NVA NVA NVA Totals
max. 5 pieces max. 5 pieces FIFO FIFO Process 1 Process 3 Shipping Prod Control Process 2 Process n Future-State Design Completed Future-State Map Daily orders Daily orders Customer Supplier Customer requirement Raw- material shipments Product delivery Raw-material supermarket Scrap IP kanban Std Work Supermarket Std Work Std Work Std Work Std Work C/T reduction Changeover Downtime
Process 1 Process 3 Shipping Prod Control Process 2 Process n Implementation Planning Daily orders Daily orders Customer Supplier Supplier Loop Customer Loop Customer requirement Raw- material shipments Product delivery Raw-material supermarket Finished-goods supermarket Scrap IP kanban Std Work Supermarket Std Work Std Work Std Work Std Work C/T reduction Changeover Downtime Process Loop 1 Process Loop 2
Value Stream Mapping Top-Level Mapping, Lean Design and Implementation Process Map • Map the current value stream showing the material and information flows • Measure / observe lean-implementation process data Current-state mapping • Identify Opportunities for Improvement • Design the future lean state • Map future-state material & information flows Lean future-state design • Segment the flow into “loops” for implementation planning • Develop implementation plan with schedule, owners and measurable milestones and results • Execute plan Implementation planning & execution
Other VSM Tools • Brown Papers • Spaghetti Diagram (product, people & information movement) • Swim Lane • Standard Work Layout
Describes a process in a more informal way Usually done in groups or teams Shows the “big picture” Is high touch, low-tech Identifies strengths and opportunities Captures the complexity and disconnects of key operational issues Gets stakeholders involved in process Brown Paper VSM
Order Scheduling Process 1 • • • • Strengths • • Enter labor rqmts into scheduling system Print schedule and distribute • • • ---- • ----- • ------ • --- Enter order info. into scheduling system Print machine schedule Receive copy of Customer Order Report 2 No (70%) No (90%) Orders > Capacity? Call Area Manager to schedule overtime Develop labor rqmts for schedule Opportunities Overtime Scheduling Process OT Required? 1. ---------------------- 2. ----------------- Yes (10%) Yes (30%) Builders: Reviewers OT Graph Customer Order Prioritization Process 1 - 2 hours 2 hours 1 hour .5 - 4 hours Brown Paper Example
Brown Paper Example:Configured Computer to User “Brown Paper” Flow Chart Time = 88 Days From Request to Configured-to-User … Suppose the “Users” Were Satisfied? • Frictional Interfaces • Too Many Steps • Lots of Rework
Brown Paper Example:Simplified Process - Customer Value Focus • New (“To-Be”) Flow • Time = 11 to 17 Days (varies w/user needs) • Saved US$1.3M; 784K Was Annual Labor • Flow Simplified • Standardized Configurations • Steps Removed • Friction Removed • Decisions Pushed to Lowest Level Real Benefits From One BE Event including Robust Follow-Up & Sustainment
Work Flow: Travel Expense Reimbursement Business Travel Expense Reporting Accounting Sales • Gathers receipts • Enters in Excel spreadsheet • Tapes receipts to printer paper • Mail goes to Accounting. • AP clerk opens and sorts mail. • AP clerk verifies numbers, receipts and policy compliance on Expense Report. 25% are returned for correction. • AP Clerk puts in mail to Payroll. • Prints 2 copies of Excel Spreadsheet • Puts Expense Report in outgoing mail. Files 2nd copy. • Photocopies Excel spreadsheet and receipts. • Payroll enters data into payroll system. • Payment appears on employee’s next check. Payroll
VA Time Line NVA Value Stream Map – Travel Expense Reimbursement 10 min 20 min 3 min 5 min 3 min
VA Time Line NVA Value Stream Map – Travel Expense Reimbursement 3 min 10 min 5 min 300 min 12 min
VA Time Line NVA Value Stream Map – Travel Expense Reimbursement No Yes Totals 5 min 2 min 670 / 1150 min 0 min / 480min 2 min 300 min
Some Guidelines for Mapping • Focus on the physical work steps that are performed, not the outputs. • Maps do not loop back because the time marches on. • The customer is still waiting for the output. • Work time cannot be erased and redone. • Gather factual data based on current observations.