Download
1 / 1
40 likes | 364 Views
Structural Behavior of Deck-Stiffened Arch Bridges Allen C. Sit, Sanjay. R. Arwade, University of Massachusetts, Amherst. David Billington’s The Role of Science In Engineering: Force Follows Form. I A = I G /2. Influence of Deck-Stiffening on Arch Bending. W = W A + W G

E N D
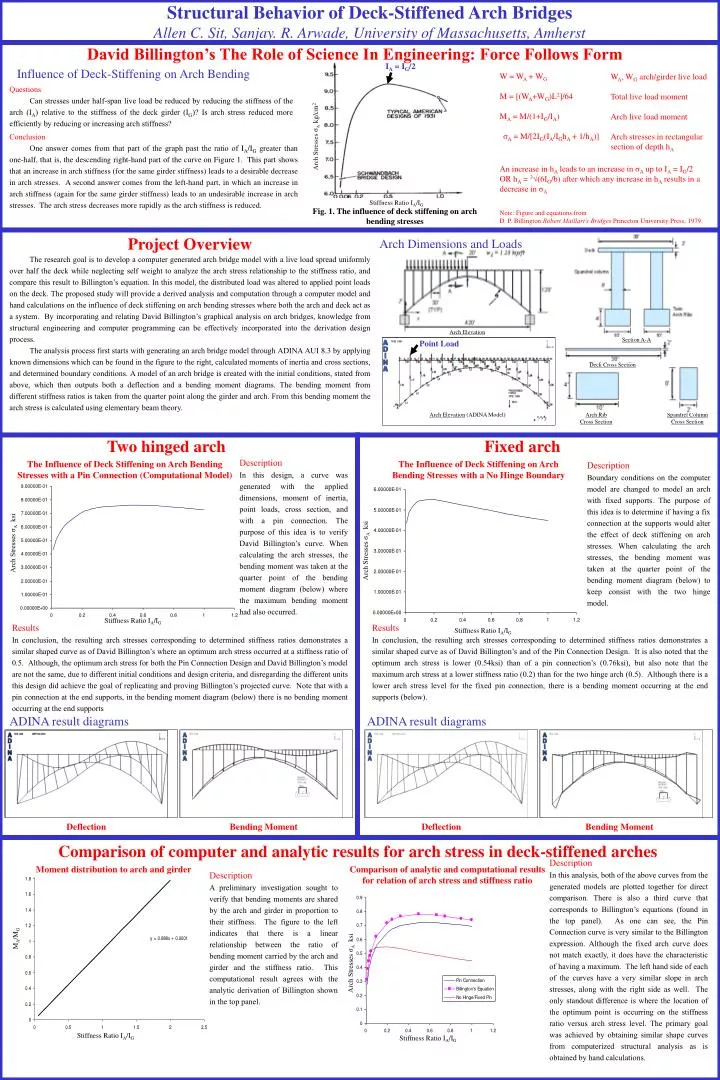
Structural Behavior of Deck-Stiffened Arch Bridges Allen C. Sit, Sanjay. R. Arwade, University of Massachusetts, Amherst David Billington’s The Role of Science In Engineering: Force Follows Form IA = IG/2 Influence of Deck-Stiffening on Arch Bending W = WA + WG M = [(WA+WG)L2]/64 MA = M/(1+IG/IA) σA = M/[2IG(IA/IGhA + 1/hA)] WA, WG arch/girder live load Total live load moment Arch live load moment Arch stresses in rectangular section of depth hA Questions Can stresses under half-span live load be reduced by reducing the stiffness of the arch (IA) relative to the stiffness of the deck girder (IG)? Is arch stress reduced more efficiently by reducing or increasing arch stiffness? Arch Stresses σA kg/cm2 Conclusion One answer comes from that part of the graph past the ratio of IA/IG greater than one-half, that is, the descending right-hand part of the curve on Figure 1. This part shows that an increase in arch stiffness (for the same girder stiffness) leads to a desirable decrease in arch stresses. A second answer comes from the left-hand part, in which an increase in arch stiffness (again for the same girder stiffness) leads to an undesirable increase in arch stresses. The arch stress decreases more rapidly as the arch stiffness is reduced. An increase in hA leads to an increase in σA up to IA = IG/2 OR hA = 3√(6IG/b) after which any increase in hA results in a decrease in σA Stiffness Ratio IA/IG Fig. 1. The influence of deck stiffening on arch bending stresses Note: Figure and equations from D. P. Billington Robert Maillart’s Bridges Princeton University Press, 1979. Project Overview The research goal is to develop a computer generated arch bridge model with a live load spread uniformly over half the deck while neglecting self weight to analyze the arch stress relationship to the stiffness ratio, and compare this result to Billington’s equation. In this model, the distributed load was altered to applied point loads on the deck. The proposed study will provide a derived analysis and computation through a computer model and hand calculations on the influence of deck stiffening on arch bending stresses where both the arch and deck act as a system. By incorporating and relating David Billington’s graphical analysis on arch bridges, knowledge from structural engineering and computer programming can be effectively incorporated into the derivation design process. The analysis process first starts with generating an arch bridge model through ADINA AUI 8.3 by applying known dimensions which can be found in the figure to the right, calculated moments of inertia and cross sections, and determined boundary conditions. A model of an arch bridge is created with the initial conditions, stated from above, which then outputs both a deflection and a bending moment diagrams. The bending moment from different stiffness ratios is taken from the quarter point along the girder and arch. From this bending moment the arch stress is calculated using elementary beam theory. Arch Dimensions and Loads Arch Elevation Section A-A Point Load Deck Cross Section Arch Elevation (ADINA Model) Arch Rib Cross Section Spandrel Column Cross Section Two hinged arch Fixed arch Description In this design, a curve was generated with the applied dimensions, moment of inertia, point loads, cross section, and with a pin connection. The purpose of this idea is to verify David Billington’s curve. When calculating the arch stresses, the bending moment was taken at the quarter point of the bending moment diagram (below) where the maximum bending moment had also occurred. The Influence of Deck Stiffening on Arch Bending Stresses with a Pin Connection (Computational Model) The Influence of Deck Stiffening on Arch Bending Stresses with a No Hinge Boundary Description Boundary conditions on the computer model are changed to model an arch with fixed supports. The purpose of this idea is to determine if having a fix connection at the supports would alter the effect of deck stiffening on arch stresses. When calculating the arch stresses, the bending moment was taken at the quarter point of the bending moment diagram (below) to keep consist with the two hinge model. Arch Stresses σA ksi Arch Stresses σA ksi Stiffness Ratio IA/IG Results In conclusion, the resulting arch stresses corresponding to determined stiffness ratios demonstrates a similar shaped curve as of David Billington’s where an optimum arch stress occurred at a stiffness ratio of 0.5. Although, the optimum arch stress for both the Pin Connection Design and David Billington’s model are not the same, due to different initial conditions and design criteria, and disregarding the different units this design did achieve the goal of replicating and proving Billington’s projected curve. Note that with a pin connection at the end supports, in the bending moment diagram (below) there is no bending moment occurring at the end supports Results In conclusion, the resulting arch stresses corresponding to determined stiffness ratios demonstrates a similar shaped curve as of David Billington’s and of the Pin Connection Design. It is also noted that the optimum arch stress is lower (0.54ksi) than of a pin connection’s (0.76ksi), but also note that the maximum arch stress at a lower stiffness ratio (0.2) than for the two hinge arch (0.5). Although there is a lower arch stress level for the fixed pin connection, there is a bending moment occurring at the end supports (below). Stiffness Ratio IA/IG ADINA result diagrams ADINA result diagrams Deflection Bending Moment Deflection Bending Moment Comparison of computer and analytic results for arch stress in deck-stiffened arches Description In this analysis, both of the above curves from the generated models are plotted together for direct comparison. There is also a third curve that corresponds to Billington’s equations (found in the top panel). As one can see, the Pin Connection curve is very similar to the Billington expression. Although the fixed arch curve does not match exactly, it does have the characteristic of having a maximum. The left hand side of each of the curves have a very similar slope in arch stresses, along with the right side as well. The only standout difference is where the location of the optimum point is occurring on the stiffness ratio versus arch stress level. The primary goal was achieved by obtaining similar shape curves from computerized structural analysis as is obtained by hand calculations. Moment distribution to arch and girder Comparison of analytic and computational results for relation of arch stress and stiffness ratio Description A preliminary investigation sought to verify that bending moments are shared by the arch and girder in proportion to their stiffness. The figure to the left indicates that there is a linear relationship between the ratio of bending moment carried by the arch and girder and the stiffness ratio. This computational result agrees with the analytic derivation of Billington shown in the top panel. MA/MG Arch Stresses σA ksi Stiffness Ratio IA/IG Stiffness Ratio IA/IG