Download
1 / 25
250 likes | 432 Views
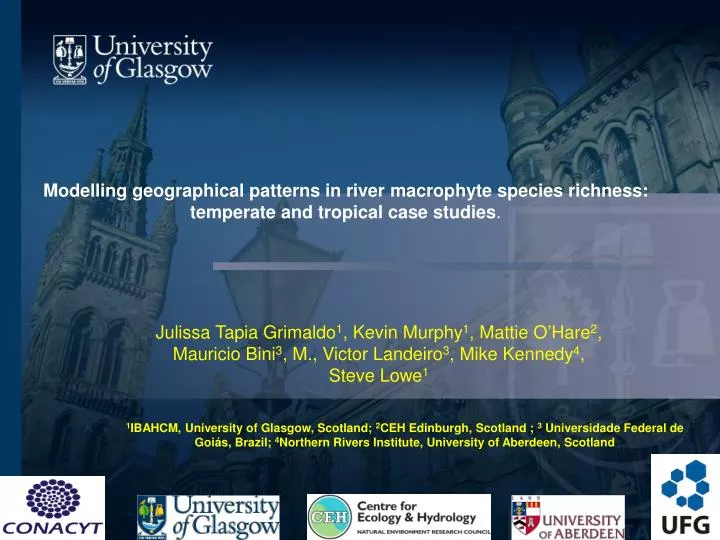
Modelling geographical patterns in river macrophyte species richness: temperate and tropical case studies. Julissa Tapia Grimaldo 1 , Kevin Murphy 1 , Mattie O ’ Hare 2 , Mauricio Bini 3 , M., Victor Landeiro 3 , Mike Kennedy 4 , Steve Lowe 1.

E N D
Modelling geographical patterns in river macrophyte species richness: temperate and tropical case studies. Julissa Tapia Grimaldo1, Kevin Murphy1, Mattie O’Hare2, Mauricio Bini3, M., Victor Landeiro3, Mike Kennedy4, Steve Lowe1 1IBAHCM, University of Glasgow, Scotland; 2CEH Edinburgh, Scotland ; 3Universidade Federal de Goiás, Brazil; 4Northern Rivers Institute, University of Aberdeen, Scotland
Geographic patterns of species distribution are central to ecology. A number of studies have shown a remarkably strong association between contemporary climate and species richness. According to the “water-energy dynamics hypothesis” species richness at higher latitudes is controlled by the availaility of ambient heat, whereas in the thermally-suitable tropics, water and humidity-related variables are the main driving factors. Drivers of aquatic macrophyte diversity Introduction. Ludwigia senegalensis, Hydrocotyle bonarensis at Kabwe River, Zambia Hawkins et al. 2003; Francis and Curie 2003, Currie et al. 2004; Field et al. 2005; Diniz-Filho and Bini, 2005.
Drivers of aquatic macrophyte diversity • The sensitivity of most plants to frost and drought may constrain their richness outside warm and humid regions. • Other hypotheses look at habitat heterogeneity governing richness gradients by local and regional species turnover • Historical and evolutionary hypotheses attribute species richness gradients to geographic differences in the geological and climatic history The Burren limestone area of Western Ireland: a hotspot for hardwater river macrophyte diversity in the British Isles Currie et al. 2004; Shmida and Wilson, 1985; Ricklefs 1987; Qian and Ricklefs 2000.
Drivers of aquatic macrophyte diversity • Spatialanalysisin conservation can helpusto describe thepatterns of diversity at differentscales, allowingustoaddressquestionssuch as: • Howdoesthespatialstructure of speciesdistributionpatternsaffectecosystemservices? • Howdoesthespatialscale of human activityimpactbiodiversityorbiologicalinteractions? • Can spatiallyexplicitconservationplans be developed? • Are biodiversitypatternsdrivenbyclimate?
Drivers of aquatic macrophyte diversity Fig. 2 Diversity of vascular aquatic macrophytes: number of species/number of genera per biogeographic region. PA: Palaearctic, NA: Nearctic, OL: Oriental, NT: Neotropical, AT: Afrotropical, Au: Australasian, PAC: Pacific Oceanic Islands Chambers et al, 2008
Drivers of aquatic macrophyte diversity What are the global patterns and determinants of vascular plant diversity in hardwater rivers? High latitude hardwater river River Lonan, Scotland: 56oN Low latitude hardwater river Lukulu River, Zambia: 11oS
Drivers of aquatic macrophyte diversity Hypotheses • macrophyte diversity is driven by global-scale (latitudinal) factors • macrophyte diversity is driven by local-scale environmental and anthropogenic factors. • project specifically addresses one type of freshwater habitat: hardwater (calcareous) rivers, which occur in many different parts of the world • both tropical and temperate. Goredale Beck, Yorkshire: a small limestone stream with high macrophyte diversity
Drivers of aquatic macrophyte diversity Objectives • To examine the relative importance of latitudinal and other drivers of aquatic plant diversity in one type of freshwater habitat: calcareous rivers, found all over the planet. • To describe assemblage patterns which occur in different types of calcareous streams, and to assess their variability in terms of a range of structural and ecological metrics within these types • To assess suitability of using variation • away from “expected” macrophyte • diversity as a possible metric for use • in ecological freshwater quality • assessment. Pontoon crossing, Kasanka River, Zambia
Drivers of aquatic macrophyte diversity Methods The data are collected using a combination of sources (i) at whole-river scale (ii) an intermediate approach, at stretch scale (usually 1 – 20 km) (iii) at small-scale, usually utilizing a standard 100 m length of river, usually with >1 sampling stretch per river Rivers are selected based on their alkalinity and limnology Data obtained from a wide range of sources (published sources; databases; primary survey
Drivers of aquatic macrophyte diversity Case Study of hardwater river macrophyte diversity in the British Isles and Zambia British Isles (n = 1732 sites) Zambia (n = 162 sites)
Drivers of aquatic macrophyte diversity Hardwater river sites sampled: British Isles Macrophyte diversity hotspots Scotland Outer Isles machair streams Western Ireland limestone rivers Southern England chalk streams
Drivers of aquatic macrophyte diversity Hardwater river sites sampled: Zambia Macrophyte diversity hotspots Upper Zambezi Kasanka/ Bangweulu Lower Zambezi
Drivers of aquatic macrophyte diversity Results Data analysis: a geostatistical case study of hardwater macrophyte diversity distribution in hardwater rivers of the British Isles and Zambia Spatialstructures in vegetationdistributionmaynotonlyresultfromecologicalinteractions, theymayalsoplayanessentialfunctional role in organizingtheinteractions. Modelingspatialpatterns at multiplespatial and temporal scalesusing: • PCNM (principal coordinates of neighbor matrices), achieving a spectraldecomposition of thespatialrelationshipsamongsites, creating variables thatcorrespondtoallthespatialscales in a dataset. • Significant PCNM variables weredirectlyinterpreted in terms of spatialscales, and included in a procedure of variationdecompositionwithrespecttospatial and environmentalcomponents.
Drivers of aquatic macrophyte diversity Results • According to the climate - environmental multiple regression model for the British Isles most of the variation in macrophyte species richness was explained by spatially structured environmental variation (16%). • The pure environmental and spatial variation effects accounted for smaller figures (2% and 12%, respectively) with 70% of variation unexplained. • For climate variables in British Isles mean temperature (R2=17%) and AET (R2=0.84%) affected species richness significantly (p<0.001). In terms of water chemistry the only water variable that had a significant effect on the species richness was alkalinity R2=15% (p<0.001). • PCNM1 = shows a negative correlation with Alk(-0.50) and MATEMP(-0.263) and TSEA(-0.653), a positive correlation with AET (0.316). • PCNM2 = depicts a positive correlation with Alk(0.258), MATEMP(0.306) and with TSEA(0.475), a negative correlation with AET (-0.141). • PCNM6 = ilustrates a negative correlation with Alk(-0.206) and MATEM (-0.221) possitive correlation with TSEA(0.078) and AET(0.089).
Drivers of aquatic macrophyte diversity PCNMS British Isles Results Figure 9. Ordination diagrams for the significant PCNM vectors at the bioregion extent in British Isles. Vectors appear in order of importance. Y and x axis are approximate latitude and longitude of the 1732 study sites. The size of the symbols is associated with eigenvector values, from negative (small symbols) to strongly positive values (larger symbols). Splines show the actual values for each PCNM vector (function ordisurf in package vegan 1.17-2 in R 2.10.1 program).
Drivers of aquatic macrophyte diversity Results • The climate - environmental multiple regression model for Zambia, showed that a higher proportion of the variation in macrophyte species richness was explained by spatial variation (25%), pure environmental variation (3%) and spatially structured environmental variation (2%) with 70% variation unexplained.
Drivers of aquatic macrophyte diversity Results PCNMS Zambia Figure 10. Ordination diagrams for the significant PCNM vectors at the bioregion extent in Zambia. Vectors appear in order of importance. Y and x axis are approximate latitude and longitude of the 162 study sites. The size of the symbols is associated with eigenvector values, from negative (small symbols) to strongly positive values (larger symbols). Splines show the actual values for each PCNM vector (function ordisurf in package vegan 1.17-2 in R 2.10.1 program).
Drivers of aquatic macrophyte diversity Variation partitioning The total variation explained (27 – 28%) for spatially-related predictors is similar from each region, and substantially higher than the variation explained by local environmental factors. This supports the hypothesis that global-scale (e.g. latitudinal) factors are more important than small-scale environmental factors in predicting macrophyte richness in hardwater rivers, for at least one temperate and one tropical region. Figure 8. Results of variation partitioning of macrophyte species richness and community structure in Zambia and British.
In conclusion: Thegeostatisticalapproach, PCNM, islikelytoprove instrumental foridentifyingrichnesspatterns in aquatic vascular plants. • Further work is needed to examine drivers of the unexplained variation, but on this evidence PCNM appears to show promise as an approach suitable to analyze patterns in macrophyte species richness, taking into account spatial autocorrelation at different spatial scales.
Drivers of aquatic macrophyte diversity Acknowledgements. • Funding for the PhD project from CONACYT, México • For help with fieldwork: in particular Dr Pauline Lang (UK), Dr. Jonathan Taylor (South Africa), Dr. Thomas Davidson (UK/ Botswana), Dr. Juan Neiff (Argentina), Kasanka Trust (Zambia), Profa. Edna Scremin-Diaz (Brazil), Prof. Nei Thomaz (Brazil), Ms. Elaine Benzies (UK); Dra. Flávia Bottino (Brazil); Ms. Sara Varandas Martins (Portugal) • People all over the world who have generously supplied data in support of the project: too many to mention here
References Chambers P.A., Lacoul P. And Murphy K.J.(2008). Global diversity of aquatic macrophytes in freshwater. Hydrobiologia,595:9-26. Currie D.J., Mittelbach G., Cornell, H.V., Field R., Guégan J., Hawkins B.A., Kaufman D.M., Kerr J.T., Oberdorff T., O’Brien E.M., Turner J.R.G. (2004). Ecological Letters, 7:1121-1134. Diniz-Filho J.A. and Bini L.M. (2005). Modelling geographical patterns in species richness using eigenvector-based spatial filters. Global Ecology and Biogeography, 14: 177-185. Hawkins B.A., Porter, E.E. And Diniz-Filho J.A.F. 2003. Productivity and history as predictors of the latitudinal diversity gradient of terrestrial birds. Ecology, 84(6):1603-1623. Field R., O’Brien E.M. And Whittaker, R.J. (2005). Global models for predicting woody plant richness from climate: Development and evaluation. Ecology 86(9):2263-2277. Francis A.P. And Currie D.J. (2003). A globally consistent richness-climate relationship of angiosperms. American Naturalist, 161(4): 523-536. Qian H. And Ricklefs R.E. (2004). Taxon richness and climate in angiosperms: Is there a globally consistent relationship that precludes region effects? American Naturalist, 163(5):773-779. Ricklefs R.E. (1987). Community diversity relative roles of local and regional processes. Science, 235(4785) 167-171. Shmida A. and Wilson M.V. (1985). Biological determinants of species diversity. Journal of Biogeography, 12(1):1-20.