Download
1 / 28
290 likes | 506 Views
Development of a Macrophyte -based IBI for Minnesota Lakes. Marcus Beck University of Minnesota Department of Fisheries, Wildlife, and Conservation Biology Hodson Hall, 1980 Folwell Ave., St. Paul, MN 55108. Project Background. Identification of a set of indicators

E N D
Development of a Macrophyte-based IBI for Minnesota Lakes Marcus Beck University of Minnesota Department of Fisheries, Wildlife, and Conservation Biology Hodson Hall, 1980 Folwell Ave., St. Paul, MN 55108
Project Background • Identification of a set of indicators responsive to changes in lake quality “To develop an ecological assessment method for Minnesota lakes that meets the requirements of the CWA through the vehicle of the SLICE program.” • Literature Review • Data Search • Index Development http://www.mndnr.gov/fisheries/slice/index.html
Today’s Talk Developing the index • Methods and analyses • Initial results • Project culmination
Today’s Talk • Literature review and data search suggested one thing… • Development of a Macrophyte-based lake IBI
Why use aquatic plants? • Relation to fish community • Immobile • Ease of identification • Available data • Lessons from Wisconsin
Species Richness Trophic Function Taxa Richness Number of darter species Number of insectivore species Number of omnivore species Analyze Biological Attributes Collect Data Abundance/Condition Number per meter DELT (deformities, eroded fins, lesions, tumors) Sum of Metric Scores = IBI Select, Verifyand Score Metrics Interpretation of IBI Score 6 100 Excellent 10 90 5 80 Good 7 70 Metric Scores 4 60 Fair IBI Score 5 Number of Darter Species 3 50 40 2 Poor 2 30 0 20 1 Very Poor 10 0 0 0 20 40 60 80 100 0 20 40 60 80 100 % Watershed Disturbance %Watershed Disturbance
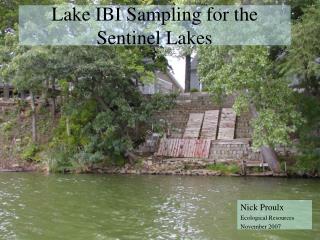
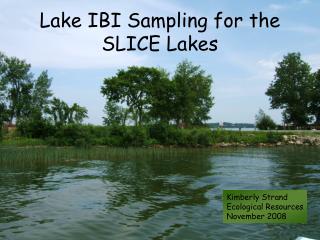
Development Methods • DNR Point Intercept surveys(Madsen 1999) • 82 lakes, 105 surveys • Lake classes same as fish IBI
Distribution of lake classes within dataset. Lake classes are defined by size, depth, chemical fertility, and length of growing season (Schupp 1992). Location of lakes by ecoregion used for IBI development.
AMCI (Weber et al. 1995; Nichols et al. 2000) “…a multipurpose, multimetric tool to assess the biological quality of aquatic plant communities in lentic systems.” Nichols et al. 2000 • Maximum depth of plant growth • Percentage of littoral zone vegetated • Simpson’s Diversity Index • Relative frequency of submersed species • Relative frequency of sensitive species • Relative frequency of exotic species • Taxa number Regional Adaptation?
Development Methods • Regional adaptations • Exotic, submersed, sensitive spp. in MN • MPCA wetland FQA, appendix A http://www.pca.state.mn.us/publications/wetlandassessment-guide.html
Index Analysis • Correlations to measured levels of disturbance • TSI, watershed land use • Ecoregion differences • Metric sensitivity analysis • Metric redundancy analysis • Effect of variable sampling effort on IBI score
Distributions of seven raw metric scores for a sample of MN lakes (n=105).
Standardized metric scores for Simpson’s Diversity metric plotted against raw metric scores.
Initial Results R² 0.6364 P<0.0001 Least-squares regression of IBI scores against Trophic State Index (Carlson 1977) for a sample of MN lakes (n=105). Results of the regression model are significant.
Least-squares regression of IBI scores against TSI separated by ecoregion (n=105). Results of the regression models are significant for the NLF and NCHF ecoregions.
R² 0.3827 P<0.001 R² 0.1475 P<0.01 R² 0.4555 P<0.001 IBI scores plotted against the proportion of land use within a lake’s watershed (N=65). Land use proportions were arcsine square root transformed to better approximate normality.
Sensitivity Analysis • Methods in Minns et al. (1994) • Remove metric, recalculate score • Difference of original and recalculated • Variance of difference indicates sensitivity
Redundancy Analysis • Stepwise comparison between raw metrics using Pearson Correlation Coefficients (ρ) • No correlations exceed 0.8, -0.8
IBI at reduced sampling effort • Lakes oversampled at point density ~3.3 pts/acre • Scores calculated for 10% to 90% at 10% intervals for three lakes • Points randomly selected from surveys at specified level of effort • Scores calculated from means of 100 iterations for each level of effort
IBI scores and 95% confidence intervals for three lakes (Jane, Square, and Christmas) plotted against varying levels of sampling intensity. Sampling intensity is shown for 10% intervals from 10% to 100% effort. Mean IBI scores were obtained using 100 estimates of IBI scores for each level of sampling intensity. Fig. 5 IBI scores and 95% confidence intervals for three lakes (Jane, Square, and Christmas) plotted against varying levels of sampling intensity. Sampling intensity is shown for 10% intervals from 10% to 100% effort. Mean IBI scores were obtained using 100 estimates of IBI scores for each level of sampling intensity.
Conclusions • IBI shows predictable responses to changes in water quality for a variety of lake classes that differed by ecoregion • Sensitivity analysis suggests index is most influenced by presence of exotic species and least influenced by species richness
Conclusions • Metrics provide unique information about ecosystem health (not redundant) • The IBI is not heavily influenced by sampling effort and any effects should be considered negligible dependant upon desired management goals
Additional Analyses • Examine each metric • Relationships to determinants of WQ • Effects of seasonal, annual variability • Management questions, e.g. sampling differences/taxonomic resolution?
Project Culmination • Inclusion of SLICE vegetation surveys • Index modification • Metric additions/modifications • Metric scoring • Comparisons to fish IBI • Future work?
Acknowledgements • Minnesota Department of Natural Resources • DNR:Dave Wright, Ray Valley, Melissa Drake, Cindy Tomcko, Donna Perleberg, Nicole Hansel-Welch, Nick Proulx • PCA: Steve Heiskary, Joe Magner • U of M: Ray Newman, James Johnson, Susan Galatowitsch, Christy Dolph, Statistics Counseling/Statistics Department • Data sources • Field personnel • References Carlson, R.E. 1977. Trophic State Index for Lakes. Limnol. Oceanogr. 22: 361-369. Madsen, J.D. 1999. Point intercept and line intercept methods for aquatic plant management. APCRP Technical Notes Collection (TN APCRP-M1-02). U.S. Army Enginee Center, Vicksburg, MS, U.S.A. Minns, C.K., Cairns, V., Randall, R. and Moore, J. 1994. An index of biotic integrity (IBI) for fish assemblages in the littoral zone of Great Lakes' Areas of Concern. Can. J. Fish. Aquat. Sci. 51: 1804-1822. Nichols, S. 1999. Floristic quality assessment of Wisconsin lake plant communities with example applications. Lake Reserv. Manage. 15: 133-141. Nichols, S., Weber, S. and Shaw, B. 2000. A proposed aquatic plant community biotic index for Wisconsin lakes. Environ. Manage. 26: 491-502. Schupp, D.H. 1992. An ecological classification of Minnesota lakes with associated fish communities. Investigational Report 41, Section of Fisheries, Minnesota Department of Natural Resources. Weber, S., Nichols, S.A. and Shaw, B. 1995. Aquatic macrophyte communities in eight northern Wisconsin flowages. Final report to Wisconsin Department of Natural Resources, Madison, Wisconsin, U.S.A. pp. 60.
Five number summary boxplots of IBI scores separated by ecoregion (n=105).
R² 0.1036 P<0.001 Least-squares regression of IBI scores against Shoreline Development Factor for a sample of MN lakes (n=105). Results of the regression model are significant.