Download
1 / 1
10 likes | 117 Views
TFRs have been rising… Have women been having more babies?. ...it’s complicated!. TFRs can rise because of: Rise in 1st birth rate (decline in childlessness) Rise in 2nd birth rate (more women going on to have a 2nd) Rise in larger families

E N D
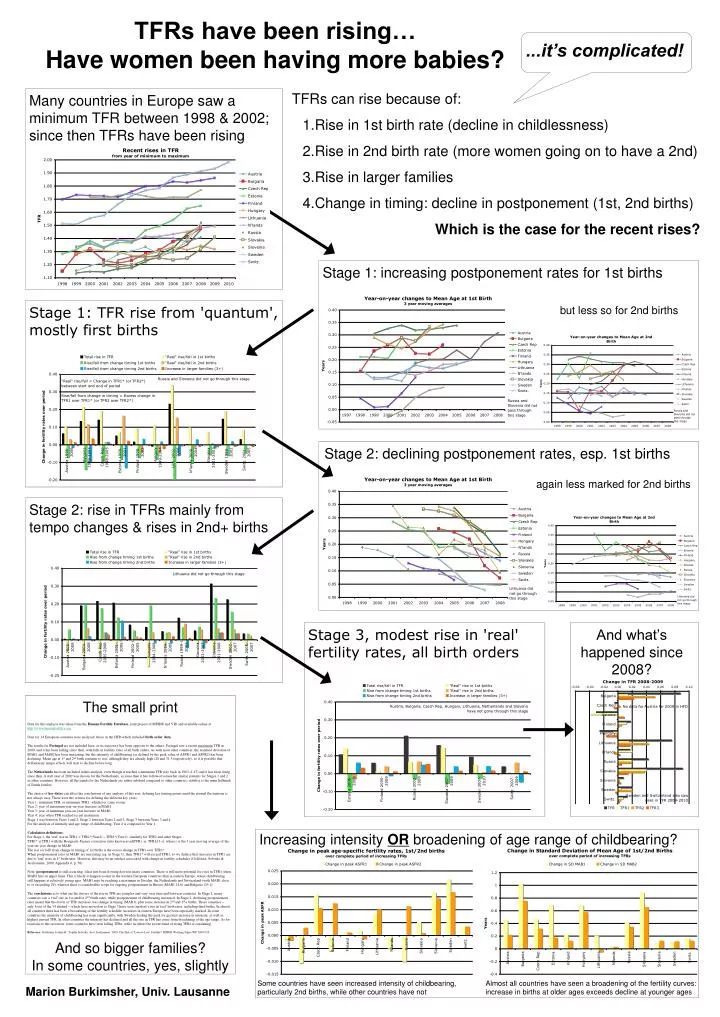
TFRs have been rising…Have women been having more babies? ...it’s complicated! • TFRs can rise because of: • Rise in 1st birth rate (decline in childlessness) • Rise in 2nd birth rate (more women going on to have a 2nd) • Rise in larger families • Change in timing: decline in postponement (1st, 2nd births) Which is the case for the recent rises? Many countries in Europe saw a minimum TFR between 1998 & 2002; since then TFRs have been rising Stage 1: increasing postponement rates for 1st births Stage 1: TFR rise from 'quantum', mostly first births but less so for 2nd births Stage 2: declining postponement rates, esp. 1st births again less marked for 2nd births Stage 2: rise in TFRs mainly from tempo changes & rises in 2nd+ births Stage 3, modest rise in 'real' fertility rates, all birth orders And what’s happened since 2008? The small print Data for this analysis was taken from the Human Fertility Database, joint project of MPIDR and VID and available online at http://www.humanfertility.org Data for 14 European countries were analysed; those in the HFD which included birth order data. The results for Portugal are not included here, as its trajectory has been opposite to the others. Portugal saw a recent maximum TFR in 2000, and it has been falling since then, with falls in fertility rates of all birth orders. As with most other countries, the standard deviation of MAB1 and MAB2 has been increasing, but the intensity of childbearing (as defined by the peak value of ASFR1 and ASFR2) has been declining. Mean age at 1st and 2nd birth continue to rise, although they are already high (28 and 31.5 respectively), so it is possible that deflationary tempo effects will start to decline before long. The Netherlands has been included in this analysis, even though it reached a minimum TFR way back in 1983 (1.47) and it has been rising since then. A start year of 2000 was chosen for the Netherlands, as since then it has followed somewhat similar patterns for Stages 1 and 2 as other countries. However, all the trends for the Netherlands are rather subdued compared to other countries; stability is the main hallmark of Dutch fertility. The choice of key dates can affect the conclusions of any analysis of this sort; defining key turning points amid the normal fluctuations is not always easy. These were the criteria for defining the different key years: Year 1: minimum TFR, or minimum TFR1, whichever came sooner Year 2: year of maximum year-on-year increase in MAB1 Year 3: year of minimum year-on-year increase in MAB1 Year 4: year when TFR reached recent maximum Stage 1 was between Years 1 and 2; Stage 2 between Years 2 and 3; Stage 3 between Years 3 and 4. For the analysis of intensity and age range of childbearing, Year 4 is compared to Year 1. Calculation definitions: For Stage 1, the ‘real’ rise in TFR1 = TFR1*(Year2) – TFR1*(Year1); similarly for TFR2 and other Stages TFR1* is TFR1 with the Bongaarts-Feeney correction (also known as adjTFR), ie. TFR1/(1-r), where r is the 3 year moving average of the year-on-year change in MAB1 The rise (or fall) from change in timing of 1st births is the excess change in TFR1 over TFR1* When postponement rates in MAB1 are increasing (eg. in Stage 1), then TFR1* will exceed TFR1, so we deduce that increases in TFR1 are due to ‘real’ rises in 1st birth rates. However, this may be an artefact associated with change in fertility schedules (Goldstein, Sobotka & Jasilioniene, 2009, Appendix 6, p. 56) Note: postponement is still occurring; it has just been slowing down in many countries. There is still more potential for rises in TFR1 when MAB1 hits its upper limit. This is likely to happen sooner in the western European countries than in eastern Europe, where childbearing still happens at relatively young ages. MAB1 may be reaching a maximum in Sweden, the Netherlands and Switzerland (with MAB1 close to or exceeding 29), whereas there is considerable scope for ongoing postponement in Russia (MAB1 24.6) and Bulgaria (25.1). The conclusions as to what are the drivers of the rise in TFR are complex and vary over time and between countries. In Stage 1, many countries saw a ‘real’ rise in 1st (and/or 2nd) birth rates, while postponement of childbearing increased. In Stage 2, declining postponement rates meant that the driver of TFR increases was change in timing (MAB1), plus some increase in 2nd and 3rd+ births. Those countries – only 6 out of the 14 studied – which have moved on to Stage 3 have seen (modest) rises in ‘real’ birth rates, including third births. In almost all countries there has been a broadening of the fertility schedule; increases in eastern Europe have been especially marked. In some countries the intensity of childbearing has risen significantly, with Sweden leading the pack for greatest increase in intensity, as well as highest current TFR. In other countries the intensity has declined and all the rise in TFR has come from broadening of the age range. As for reactions to the recession: some countries have seen falling TFRs, while in others the recent trend of rising TFRs is continuing. Reference: Goldstein, Joshua R., Tomàs Sobotka, Aiva Jasilioniene. 2009. The End of ‘Lowest-Low’ Fertility? MPIDR Working Paper WP 2009-029 Increasing intensity OR broadening of age range of childbearing? And so bigger families?In some countries, yes, slightly Some countries have seen increased intensity of childbearing, particularly 2nd births, while other countries have not Almost all countries have seen a broadening of the fertility curves: increase in births at older ages exceeds decline at younger ages Marion Burkimsher, Univ. Lausanne