Download
1 / 11
110 likes | 192 Views
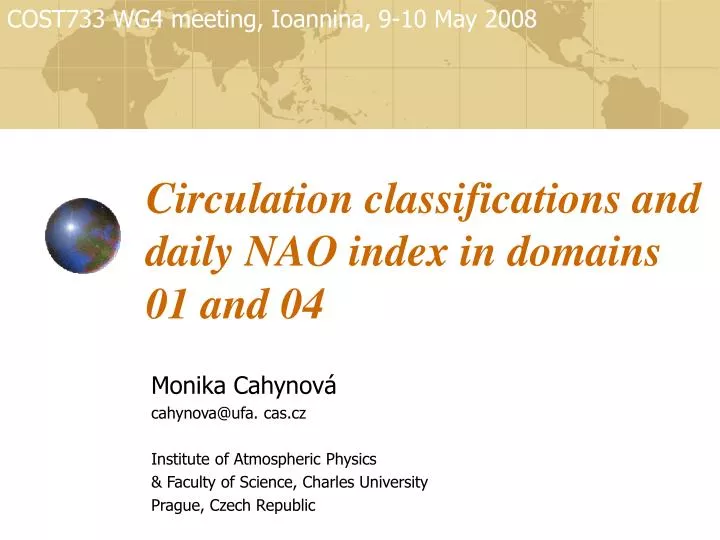
COST733 WG4 meeting, Ioannina, 9-10 May 2008. Circulation classifications and daily NAO index in domains 01 and 04. Monika Cahynová cahynova @ ufa. cas.cz Institute of Atmospheric Physics & Facult y of Science, Charles University Prague, Czech Republic. Outline.

E N D
COST733 WG4 meeting, Ioannina, 9-10 May 2008 Circulation classifications and daily NAO indexin domains 01 and 04 Monika Cahynová cahynova@ufa. cas.cz Institute of Atmospheric Physics & Faculty of Science, Charles University Prague, Czech Republic
Outline • this is an attempt to compare the results of M. J. Casado & M. A. Pastor (presented in Brussels, for D00 and D09) with other relevant domains (Iceland and the British Isles) • what are we looking for • daily NAO index, DJFM, 1957-2002, obtained from Climate Prediction Center (CPC) • percentage of days within one CT in NAO positive and negative phase • chi-square test: is the occurrence of NAO phases under one CT significantly different from the overall occurrence of NAO phases? • percentage of CTs that over-represent (under-represent, represent well) the overall frequency of NAO phases
Drawbacks • chi-square test (or, in fact, any other test) is not applicable to CTs with extremely low seasonal occurrence -> some CTs will remain untested • how to compare the results – what is a good/bad result? • every classification should produce several types that occur preferably during the NAO+ phase, several during NAO- phase • different number of CTs in every classification: rather than citing the “number” of CTs with some desired quality, we can refer to “percentage” of CTs • anyway, classifications with more CTs will be “disqualified” by the rare occurrence of individual CTs (and hence the inability to apply statistical tests)
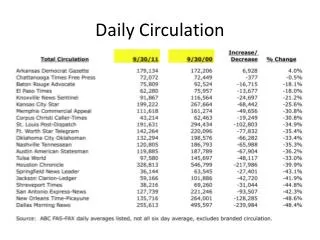
Frequency of NAO phases under each CT Casado, Pastor (Brussels) Cahynova D00 D09 D01 D04
Frequency of NAO phases under each CT Casado, Pastor (Brussels) Cahynova D00 D09 D01 D04
Frequency of NAO phases under each CT Casado, Pastor (Brussels) Cahynova D00 D09 D01 D04
Frequency of NAO phases under each CT Casado, Pastor (Brussels) Cahynova D00 D09 D01 D04
Is the frequency of NAO phases under one CT higher/lower/the same as in all the other days?(chi-square test) D01 D04 ← higher ← lower ← same higher → lower → same → CTs occurring very rarely were excluded from the analysis
Percentage of rarely occurring CTs in DJFM that were excluded from the chi-square test
Conclusions • large differences between individual classifications are present when comparing these with the daily NAO • spatial domains: different but understandable results (e.g. GWT, Lityński, LWT2) • at the north and south – cyclonicity matters • British Isles and the whole Europe (more central position) – direction of flow matters • most of the classifications produced some types that prefer either NAO+ or NAO- pattern • lowest connection of CTs to NAO phases in LWT2, NNW, PCAXTR, PCAXTRKM, TPCA07 • higher number of CTs -> rare occurrence -> disables testing