Download
1 / 29
290 likes | 385 Views
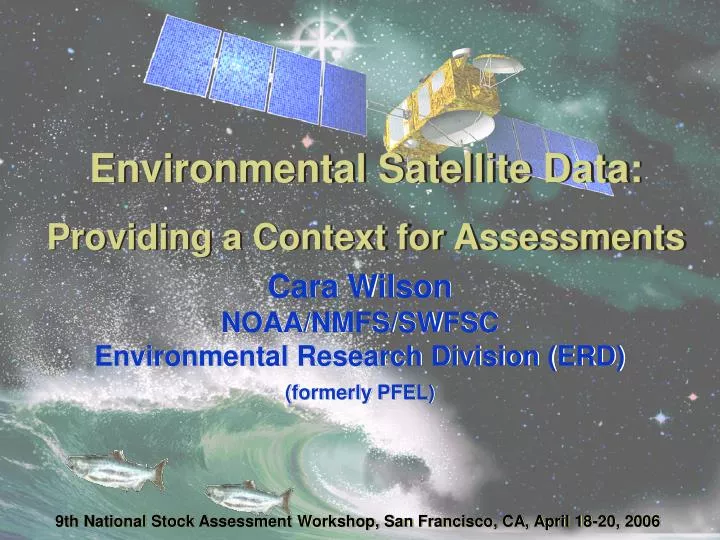
Environmental Satellite Data: Providing a Context for Assessments. Cara Wilson NOAA/NMFS/SWFSC Environmental Research Division (ERD) (formerly PFEL). 9th National Stock Assessment Workshop, San Francisco, CA, April 18-20, 2006. NMFS-Satellite group.

E N D
Environmental Satellite Data:Providing a Context for Assessments Cara WilsonNOAA/NMFS/SWFSC Environmental Research Division (ERD)(formerly PFEL) 9th National Stock Assessment Workshop, San Francisco, CA, April 18-20, 2006
NMFS-Satellite group • Satellite POCs for each science center (appointed by lab director) AFSC Jeff Napp (Seattle) NEFSC Jay O’Reilly (Narragansett) NWFSC Bill Peterson (Newport) PIFSC Jeff Polovina (Honolulu) SEFSC Tom Leming (Mississippi) SWFSC Cara Wilson (Pacific Grove) ST Kenric Osgood (Silver Spring) POC also a CoastWatch PI Labs outside of the regional HQ laboratory
Contributors Jay Barlow NOAA/NMFS/SWFSC E.A. Becker UCSB Steven Berkeley UC Santa Cruz Bob Brownell NOAA/NMFS/SWFSC Rich Charter NOAA/NMFS/SWFSC Rich Cosgrove NOAA/NMFS/SWFSC Dave Foley NOAA CoastWatch, West Coast node Karen Forney NOAA/NMFS/SWFSC M.C. Ferguson NOAA/NMFS/SWFSC Jefferson Hinke NOAA/NMFS/SWFSC Trevor Platt Bedford Institute of Oceanography Xuemei Qiu NOAA/NMFS/SWFSC ERD Jessica Redfern NOAA/NMFS/SWFSC R.C. Smith UCSB Vera Trainer NOAA/NMFS/NWFSC George Watters NOAA/NMFS/SWFSC Jay Zwally NASA/GSFC
Acknowledgments Special thanks to Stan Wilson and John Pereira (NESDIS) and NOAA’s Satellite Research & Operations (R&O) transition project
Satellite data can NOTdirectly measure populations of fish, lobsters, whales, turtles, etc.
Satellite data measures oceanic parameters of habitat and ecosystems that influence marine resources
Ocean Features Important to Ecosystems • Ocean ‘fronts’, boundaries, ‘edges’ • River plumes • Coastal regions • Mesoscale circulation patterns: eddies, meanders, ‘loops’ • Convergence zones • Subsurface thermal structure: MLD, thermocline • Ocean surface winds • Ocean currents • Wave heights Most of these ocean features can not be adequately resolved without satellite data
Temporal Events Important to Ecosystems • Upwelling • Harmful Algae Blooms (HABs) • Oil Spills • Seasonal Transitions • El Niño events • Regime Shifts (i.e. PDO) • Global Climate Change Climate change can affect the timing and/or intensity of many of these processes Climate Data Records (CDRs) of satellite measurements need to be maintained!
Some Satellite Applications Relevant to Stock Assessment Cara Wilson & R. Michael Laurs NOAA/NMFS Pacific Fisheries Environmental Laboratory David G. Foley Joint Institute for Marine and Atmospheric Research, U. Hawaii 3rd GOES-R User Workshop 10-13 May 2004 Broomfield, CO
Timing of the Spring bloom and Haddock Survival (Melanogrammus aeglefinus) Late Early ‘97 ‘98 ‘99 ‘00 ‘01 Test of the match-mismatch hypothesis Annual anomaly in the timing of the spring bloom based on SeaWiFS chlorophyll data Earlier bloom means more time in the ‘green’ zone From Platt et al., Nature, 2003 EarlyLate
Modeling Cetacean Distribution Pathfinder SST data • Easily acquired in GIS-ready format • Adequately resolves key features of CCS E.A. Becker and R.C. Smith (UCSB/ICESS) K.A. Forney, J.V. Redfern, M.C. Ferguson, J. Barlow, R. Cosgrove (NOAA/NMFS/SWFSC)
Population Analysis of Minke Whales • Abundance estimate for Antarctic Minke whales decreased from 730,000 in CPII to 360,000 in CPIII - Why?? • Changes in sea-ice distribution has been put forth as a potentially important factor. • Satellite sea-ice data is being examined to test this hypothesis. Work in progress by Brownell & Wilson, NOAA/NMFS/SWFSC ERD
Population Analysis (Balaenoptera bonaerensis) Sea Ice data provided by Jay Zwally, NASA/GSFC Data analysis by Xuemei Qiu, NMFS/SWFSC III II More ice in CP-III Less ice in CP-III I IV VI V
Population Analysis (Balaenoptera bonaerensis) Jan 1987, CP-II Jan 1998, CP-III 141,000 Minke whales 35,000 Minke whales Surveys follow ice edge Whales hidden from survey in polynya? Sea Ice data provided by Jay Zwally, NASA/GSFC Work in progress by Brownell & Wilson, NOAA/NMFS/SWFSC ERD
Population Analysis (Balaenoptera bonaerensis) More Ice = Less whales counted (more ice habitat for whales to hide in) CP-II survey CP-III survey Work in progress by Brownell & Wilson, NOAA/NMFS/SWFSC ERD
Ground Truth for Stock Assessments Sablefish(Anopoploma fimbria) • Pathfinder’s long time series allowed us to show that the SST > 15°C for a period when tagged sablefish were known to survive. • This contradicted laboratory studies of tag-related mortality used in stock assessments. • The end result will be an increase in the catch quota reflecting a more realistic stock assessment. S. Berkeley, UC – Santa Cruz
Ground Truth for Stock Assessments • Version 5 Pathfinder resolves off-shore water from coastal upwelling • 1° COADS data cannot do this.
Chinook Potential Habitat (Oncorhynchus tshawytscha) Probability Density OR OR Surface Temp CA CA Density of fish’s surface temperature experience from tag data SatelliteSST “Contours of utilization” – likely fish location NOAA/NMFS/SWFSC PFEL Hinke, Watters et al., MEPS, 2005 NOAA/NMFS/SWFSC
Cruise Support Domoic Acid levels (circles) measured during an ECOHAB survey, overlaid on top of satellite chlorophyll. Satellite chlorophyll data is crucial for monitoring development of harmful algal blooms (HABs). NOAA/NMFS/SWFSC PFEL From Vera Trainer NOAA/NMFS/NWFSC
Interannual Variability El Niño La Niña NOAA/NMFS/SWFSC PFEL Courtesy of Rich Charter, NOAA/NMFS/SWFSC
April CalCOFI egg surveys, 1997-2005 Courtesy of Rich Charter, NOAA/NMFS/SWFSC http://swfsc.nmfs.noaa.gov/frd/CalCOFI/CurrentCruise/sardmaps.htm
Question… The high temporal and spatial resolution of satellite data, and its continuity, make satellite data an important tool for monitoring and characterizing marine ecosystems. Yet, the full potential of satellite data has not been realized within NMFS, or within fisheries science more generally. Why is satellite data underutilized within NMFS, and what can be done to take advantage of the wealth of information this data can provide?
Length of Time Series • Compared to many fisheries datasets the time series of satellite data are relatively short: Sea Ice 1979SST: 1985 [2005?] SSH: 1993Chlorophyll: 1997Wind: 1999 Pathfinder project has lost its funding in 2006…. SeaWiFS SST • It’s essential that climate quality records of satellite data be maintained! • This point needs to be emphasized as NOAA takes over operation of a number of satellite measurements (i.e. ocean color and SSH). PDO Anchovy Sardine 1920 1940 1960 1980 2000 From Chavez et al. [Science, 2003]
Data Access Issues It can be difficult to access and manipulate the large depository of existing satellite data. Efforts are underway to address this: • New live access server (LAS) and browser at the west coast CoastWatch Node provide access to multiple satellite datasets, in a variety of formats, including IOOS-compatible OPeNDAP technology. • Four NMFS scholarships given this year to attend a 2-week satellite course in June at Cornell University. • A 3-day course for NMFS and NOS participants on accessing and using satellite data is being planned for Aug. 22-24 at OSU in Corvallis, OR. These activities made possible by funding by NOAA’s R&O project
SWFSC OceanWatch LAS at ERD http://oceanwatch.pfeg.noaa.gov Primary Productivity NOAA/NMFS/SWFSC PFEL
http://coastwatch.pfel.noaa.gov/coastwatch/CWBrowser.jsp New CoastWatch Browser
Satellite Data Training Course • 3-day course for NMFS and NOS participants who are interested in using satellite data • Aug 22-24, 2006 at OSU/CIOSS in Corvallis, OR • Funds available from NOAA’s Satellite Transition R&O (Research and Operations) project to cover participants’ travel costs For more information contact Cara Wilson cara.wilson@noaa.gov
NASA/NOAA Joint Workshop • NASA/NOAA Joint workshop on integrating satellite data and modeling data into ecosystem-based management within NMFS. • May 3-5, 2006 at MBARI near Monterey, CA. • Funds from NOAA’s Satellite Transition R&O (Research and Operations) project to cover NOAA participants’ travel costs.